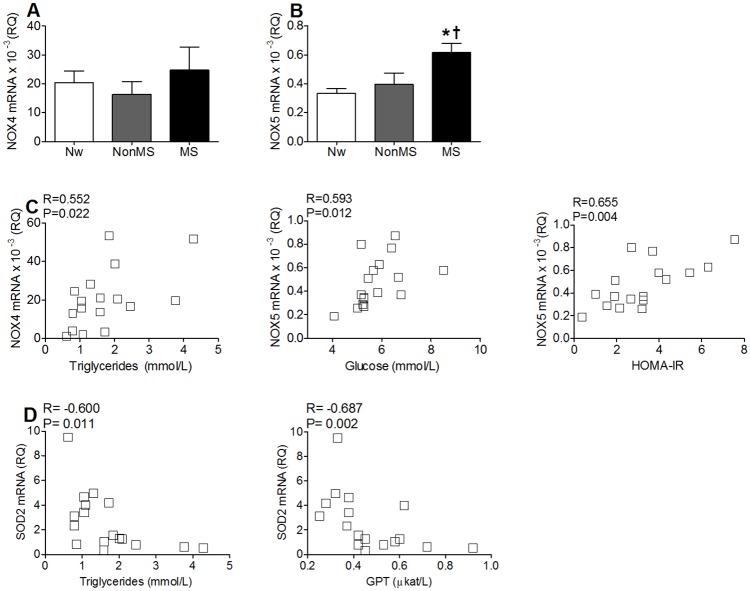
Fig 4. Expression of genes involved in cellular redox balance in visASCs exposed for 72 hours at 1% O2(g).
A-B: Levels of NOX4 (A) and NOX5 (B) mRNA expression in hypox-visASCs from subjects grouped by metabolic profile. C: Correlation between transcriptional levels of NOX4 and NOX5 mRNA with variables describing the metabolic profile of the patients. D: Correlation between mRNA expression levels of SOD2 in hypox-visASCs with plasma levels of triglycerides and GPT in the patients. (Nw, n = 3; NonMS, n = 7; MS, n = 7). *, Significantly different results (Mann-Whitney test; P < 0.05) to those of Nw subjects; †, significantly different results (Mann-Whitney test, P < 0.05) to those of NonMS subjects. Nw: normal-weight subjects; NonMS: obese subjects without metabolic syndrome; MS: obese subjects with metabolic syndrome; HOMA-IR: homeostasis model assessment to quantify insulin resistance; SOD2: superoxide dismutase 2, mitochondrial; GPT: glutamate pyruvate transaminase.

