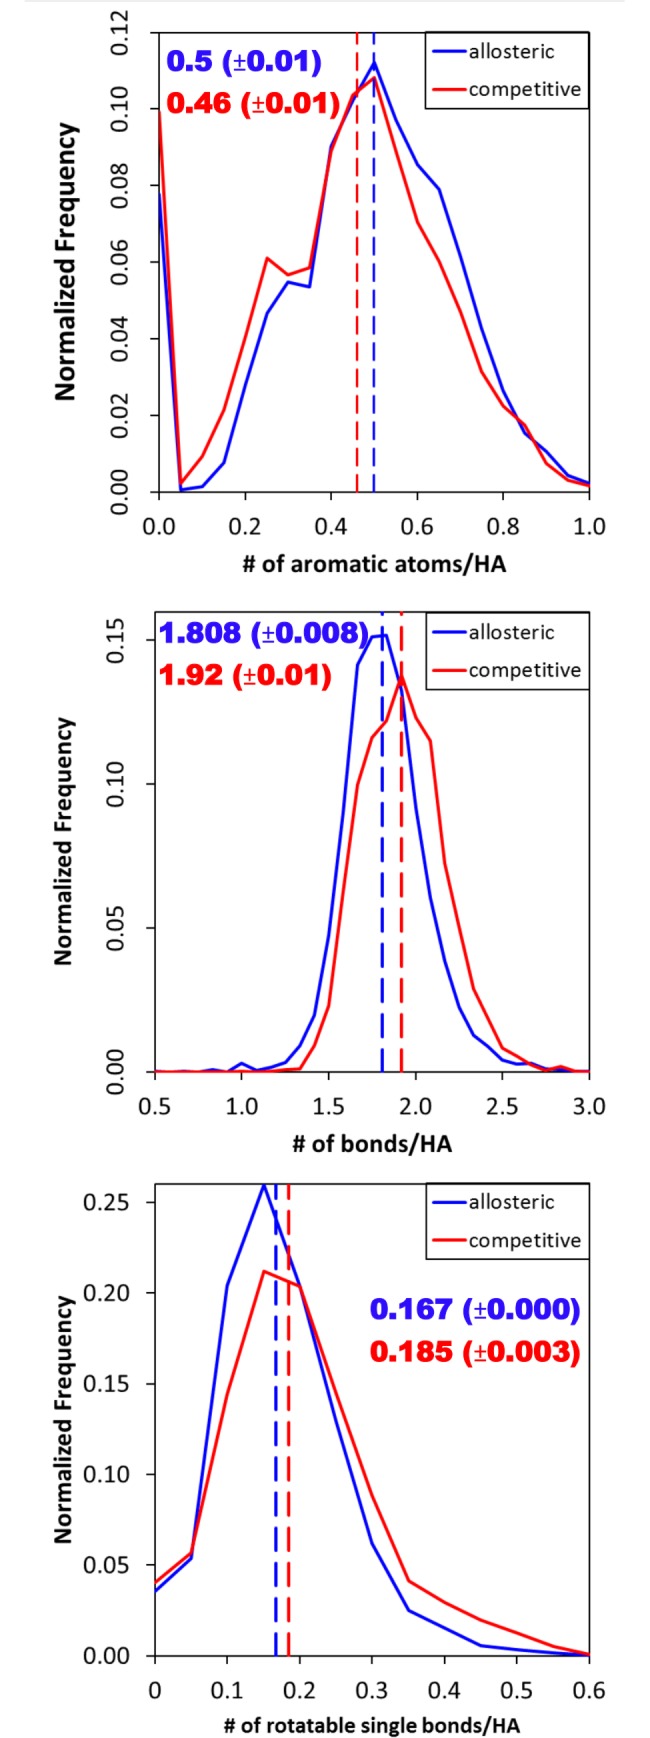
Fig 1. The normalized histograms of the number of aromatic atoms corrected by size, the number of bonds per heavy atom (HA), and the number of rotatable single bonds per HA for the full dataset (60%/0.6 clustering).

The median (dashed line) is labeled on the graph with its 95%ci derived from bootstrap sampling.
