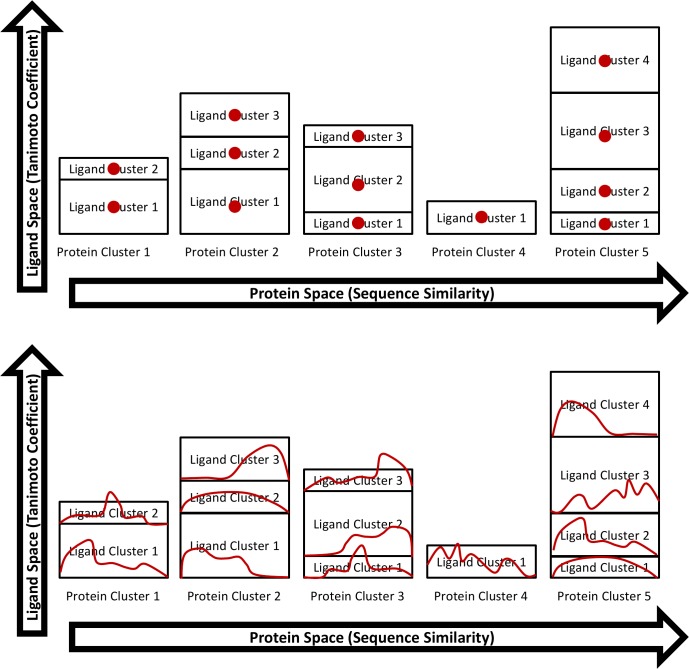
Fig 7. Weighting the data.
In the top scheme, the center of each protein-ligand cluster is chosen, and only the centers are used to calculate the distribution of properties. In the bottom scheme, all ligands of each cluster contribute to the cluster’s normalized distribution of physical properties. The normalized distributions compensate for the different number of ligands in each cluster. The normalized distributions of all clusters are simply added to give the distribution of physical properties for the entire set of data.

