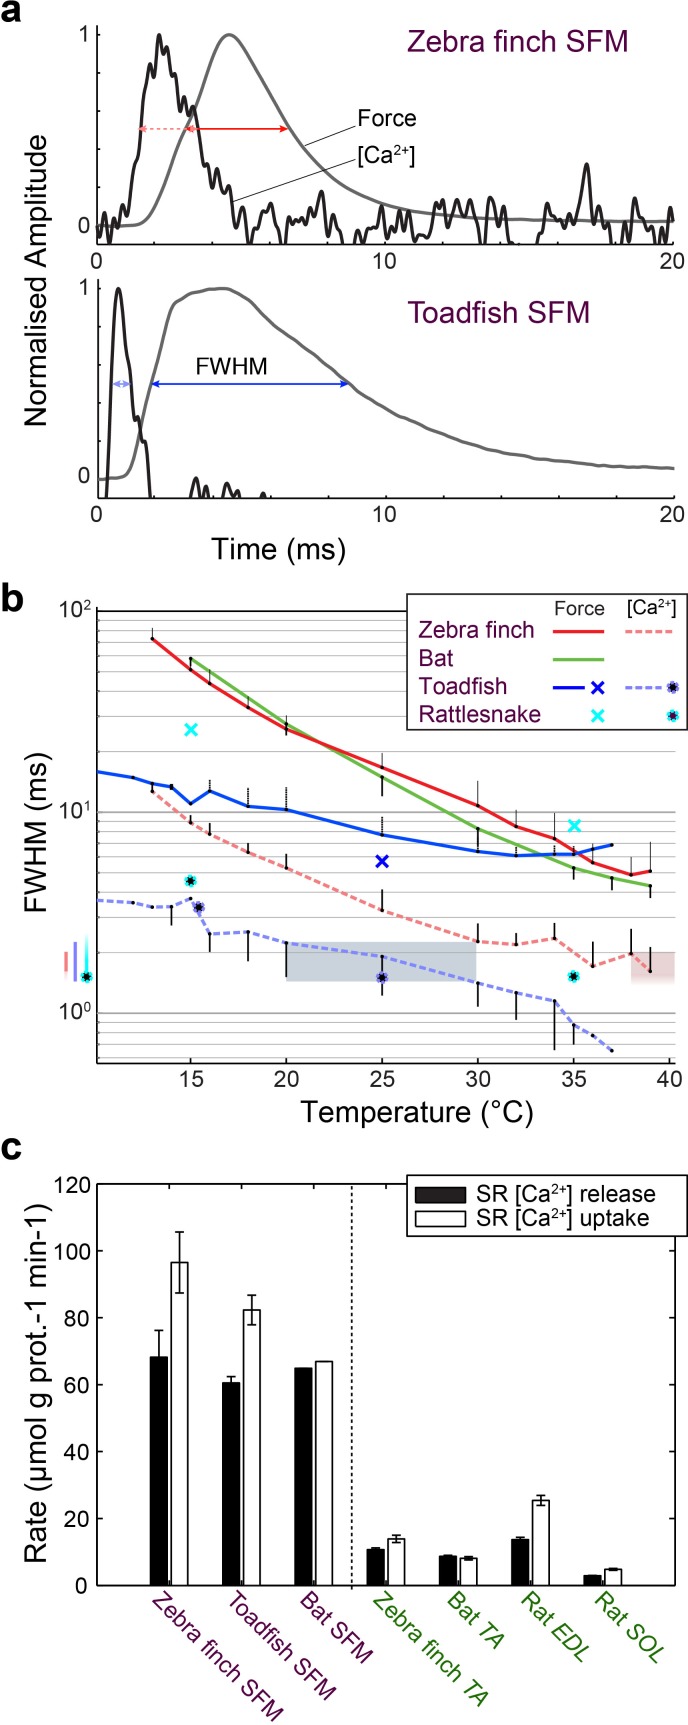
Figure 6. Superfast muscles have convergent elevated myoplasmic calcium transient dynamics.
(a) Representative force development and myoplasmic calcium concentration ([Ca2+]i) transients in songbird and toadfish SFMs. (b) Force and [Ca2+]i transient full-width-at-half-maximum (FWHM) values as a function of temperature. [Ca2+]i FWHM values converge to 1.5–2.0 ms for all SFMs (color left of ordinate) at their operating temperatures (shaded areas). Filled circle and crosses refer to toadfish and rattlesnake data from ref 6. (c) Calcium loading and unloading kinetics in isolated SR vesicles (see Materials and methods) yield similar values for bat SFMs compared to songbird and toadfish SFMs, and were significantly elevated (p<0.01, ANOVA) 5–10 times compared to intraspecific skeletal muscle in zebra finch and bat.


