. 2017 Nov 13;6:e28921. doi: 10.7554/eLife.28921

Figure 2. DMEs of the whole system are more evenly distributed than the individual component DMEs.

In the experimental system, CI acts as a tight repressor. The distributions of fluorescence are shown in the absence of CI (red) and in the presence of CI (blue). Each distribution was obtained by measuring fluorescence of two independent measurements of 500,000 cells by flow cytometry, which were then pooled together. The dashed lines separate three categories of phenotypes – ‘no expression’ phenotypes (corresponding to repressed wildtype); ‘high expression’ phenotypes (corresponding to the wildtype in the absence of CI); and ‘intermediate’ phenotypes. No expression and high expression categories are defined to include >99.9% of the wildtype fluorescence distribution in the presence and in the absence of CI, respectively. The Shannon entropy (S) is used to estimate how uniform each distribution is across the entire range of possible expression levels. The associated standard deviation (±) is given for each S value. Blue numbers are percentage of counts in each category in the presence of CI. Numbers in parentheses are percentage of counts excluding the estimated percentages of uniquely transformed individuals carrying the wildtype genotype (see Materials and methods). The naïve additive convolution prediction for each system library and the associated predictions for the frequency of mutants in each category are shown in grey. Pearson’s Chi-squared test was used to assess the difference between the observed and the convolution-predicted frequency of mutants in each category (low: χ2(2)=8.20; p<0.05; intermediate: χ2(2)=32.26; p<0.0001; and high mutation frequency library: χ2(2)=74.51; p<0.0001). The distributions of the effects of mutations for the cis-element, the trans-element, and the whole system in the absence of CI are shown in Figure 2—figure supplement 1. Figure 2—figure supplement 2 shows distributions of the effects of 150 single point mutations in the cis- and the trans-elements. Statistical significance of the differences in entropy values between the mutant libraries is shown in Figure 2—source data 3. Flow cytometry measurements of 20 individual isolates from each library are shown in Figure 2—figure supplements 3, 4 and 5, the analysis of which was used to demonstrate that gene expression noise is constant (Figure 2—source data 1). Convolutions for each mutation probability performed with the knowledge of the genetic regulatory structure of the system are shown in Figure 2—figure supplement 6, while Figure 2—figure supplement 7 provides an explanation of how convolutions were performed. The outcome of the test for how sensitive the shapes of distributions are to the number of sampled individuals is shown in Figure 2—source data 4, while the confirmation that the mutagenesis protocol resulted in expected distributions of the number of mutations are shown in Figure 2—source data 2.

Figure 2—source data 1. Gene expression noise is constant.
The flow cytometry data obtained for 20 cis, trans, and system mutant isolates from each mutation probability library was used to quantify gene expression noise. The data provided here are shown in Figure 2—figure supplements 3, 4 and 5.
DOI: 10.7554/eLife.28921.011
Figure 2—source data 2. Sequencing 40 isolates from each cis- and trans-element library confirms the predicted distribution of the number of mutations.
This data also allowed us to estimate the frequency of ‘back’ cloning (wildtype re-ligating instead of the desired insert), and of the frequency of ‘failed’ cloning (no insert of any type).
DOI: 10.7554/eLife.28921.012
Figure 2—source data 3. Differences between calculated entropy estimates are statistically significant.
P values of the differences in entropies of mutant libraries were calculated using a nonparametric permutation test.
DOI: 10.7554/eLife.28921.013
Figure 2—source data 4. Observed distributions accurately describe phenotypic distributions of possible mutations.
Comparison of random subsamples of each dataset to the full dataset using K-S test shows that observed distributions are not sensitive to reductions in sample size or mutant library diversity. We take 50 random subsamples for each subsample size of each cis- and trans-element mutant library in each relevant environment (both absence and presence of CI for cis-element libraries, only presence of CI for trans -element libraries). D-statistic from the K-S test is used to estimate significance (p value).
DOI: 10.7554/eLife.28921.014

Figure 2.

Figure 2—figure supplement 1. DMEs for cis-element, trans-element, and system libraries in the absence of CI.

Figure 2—figure supplement 1.

In the experimental system, CI acts as a tight repressor. Each distribution was obtained by measuring fluorescence of two independent measurements of 500,000 cells by flow cytometry, which were then pooled together. The dashed lines separate three categories of phenotypes. ‘No expression’ and ‘high expression’ categories are defined to include >99.9% of the wildtype fluorescence distribution in the presence and in the absence of CI, respectively. Red numbers are percentage of counts in each category in the absence of CI. Numbers in brackets are percentage of counts excluding the estimated percentage of uniquely transformed individuals carrying the wildtype genotype. DMEs of the trans-element library in the absence of CI are the same as the wildtype. DMEs of the cis-element and system libraries with equivalent mutation probability are not different from each other in the absence of CI.

Figure 2—figure supplement 2. Distribution of single mutation effects in 150 random system double mutants and their corresponding single mutants.

Figure 2—figure supplement 2.

We created 150 random unique double mutants, with one point mutation in the cis- and the other in the trans-element. We measured gene expression of each mutant at a population level in a plate reader. Histogram of expression levels in the absence and in the presence of CI are shown for: (A) point mutations in cis; (B) point mutations in trans; (C) double mutants in the system. Dotted line represents mean wildtype fluorescence in the corresponding environment. Six replicates of each mutant were measured. Grey bars indicate mutants that were not significantly different from the wildtype. The data underlying this figure are shown in Figure 3—source data 2. The data from this library are used to calculate epistasis shown in Figure 3.

Figure 2—figure supplement 3. Mutant isolates from the low mutation probability libraries.

Figure 2—figure supplement 3.

Twenty mutants were arbitrarily isolated from the cis, the trans, and the system library, and the expression of two replicates of each isolate in the presence of CI was measured for 100,000 individuals in the flow cytometer. From these measurements, we calculated the gene expression noise for each isolate (Figure 2—source data 1). Each histogram shows the combined distribution based on two replicate measurements, for each mutant isolate. The top histogram shows the monoclonal wildtype distribution in the absence (red) and in the presence (blue) of CI.

Figure 2—figure supplement 4. Mutant isolates from the intermediate mutation probability libraries.

Figure 2—figure supplement 4.

Twenty mutants were arbitrarily isolated from the cis, the trans, and the system library, and the expression of two replicates of each isolate in the presence of CI was measured for 100,000 individuals in the flow cytometer. From these measurements, we calculated the gene expression noise for each isolate (Figure 2—source data 1). Each histogram shows the combined distribution based on two replicate measurements, for each mutant isolate. The top histogram shows the monoclonal wildtype distribution in the absence (red) and in the presence (blue) of CI.

Figure 2—figure supplement 5. Mutant isolates from the high mutation probability libraries.

Figure 2—figure supplement 5.

Twenty mutants were arbitrarily isolated from the cis, the trans, and the system library, and the expression of two replicates of each isolate in the presence of CI was measured for 100,000 individuals in the flow cytometer. From these measurements, we calculated the gene expression noise for each isolate (Figure 2—source data 1). Each histogram shows the combined distribution based on two replicate measurements, for each mutant isolate. The top histogram shows the monoclonal wildtype distribution in the absence (red) and in the presence (blue) of CI.

Figure 2—figure supplement 6. Mathematical predictions that account for the genetic regulatory structure accurately describe the system DME.

Figure 2—figure supplement 6.

(A) Distribution of the monoclonal wildtype population in the absence (red) and in the presence of CI (blue). (B) Low, (C) Intermediate, and (D) High mutation probability system mutant libraries. Shown in green are the convolutions that accounted for the effects of cis mutations in the absence of CI (Figure 2—figure supplement 1). Frequencies of mutants in the three categories (‘no’, ‘intermediate’, and ‘high’ expression phenotypes) for the observed system DME are shown in blue, while those from the convolution are shown in green. Pearson’s Chi-squared statistic and the associated p value used to test for the differences between the observed and the predicted frequencies of mutants in the three categories are shown for each mutations probability.

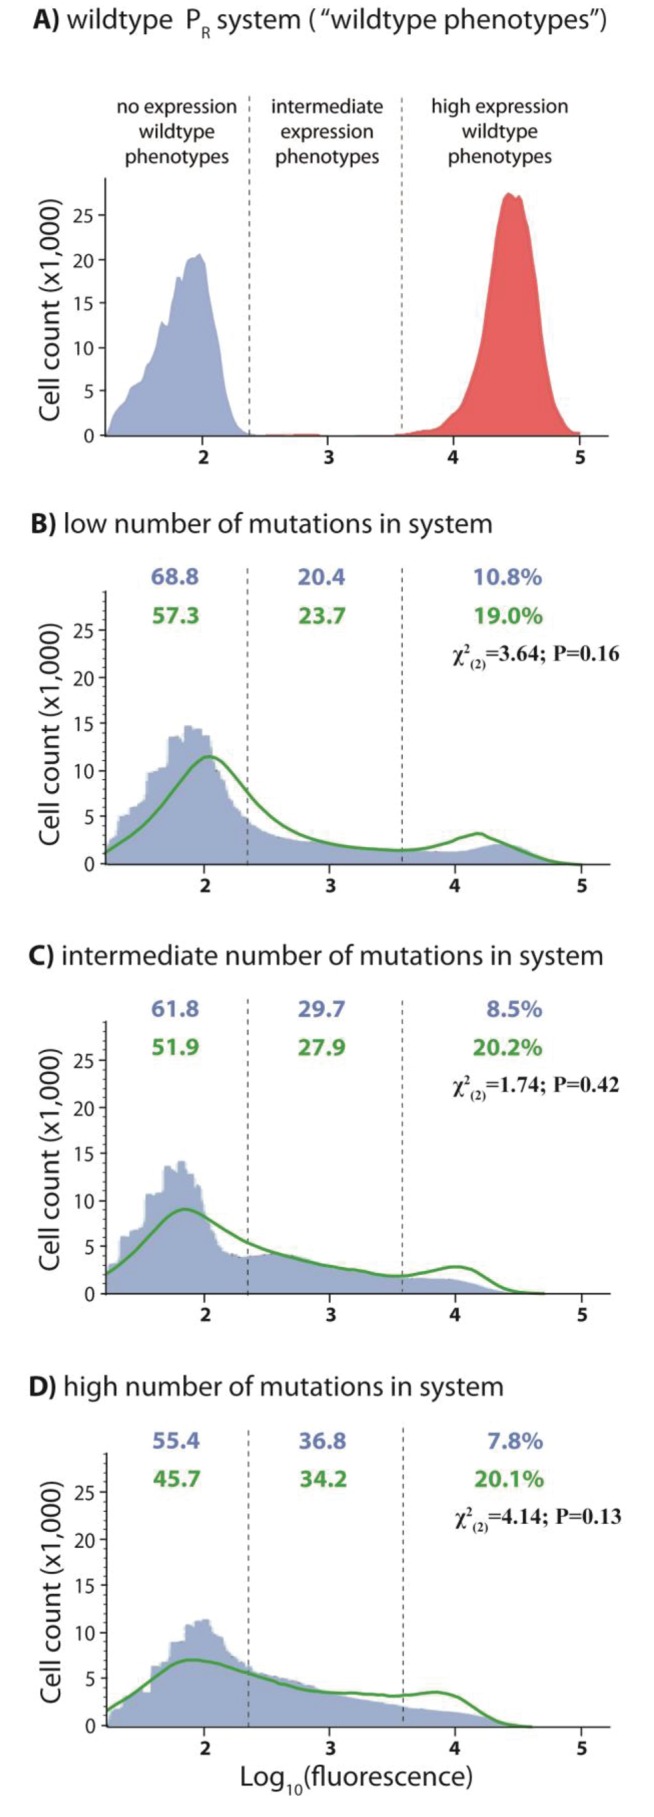
Figure 2—figure supplement 7. Predicting the system DME based on convolving component DMEs.

Figure 2—figure supplement 7.

We attempted to predict the DME for the system by convolving the corresponding DMEs of cis and trans components. To do this, we convolved the ‘true’ cis distribution (fcis) with the observed trans distribution (Ftrans). Here, we use low mutation probability trans and high mutation probability cis libraries to illustrate the procedure. (A) The ‘reverse engineered’ true cis distribution (fcis), shows how the mutations in the cis-element alter wildtype expression levels. (B) The specific fcis was chosen so to minimize the difference between the observed cis-element DME and the convolution between fcis and the observed wildtype distribution in the presence of CI (F+wt). (C) Convolving fcis with unmodified Ftrans gives a predicted system DME with values outside the biologically meaningful range. (D) In order to impose a biological limit to high expression, which is given by the wildtype expression in the absence of CI, we removed the high expression peak in the observed trans DME. This was done by fitting a fraction of the wildtype distribution in the absence of CI (α) to minimize its (square) difference to the right-hand part of the high-expression trans peak (red shaded area). (E) Modified trans DME after removing high expression phenotypes. (F) The naïve convolution prediction for the system DME is obtained by convolving fcis with the modified trans DME, and then adding back a corresponding amount of the high-expression wildtype distribution in the absence of CI. When convolving with the knowledge of the underlying genetic regulatory structure, we add back the cis DME in the absence of CI (modified by the scaling factor α). Here, the ‘naïve’ prediction is shown.