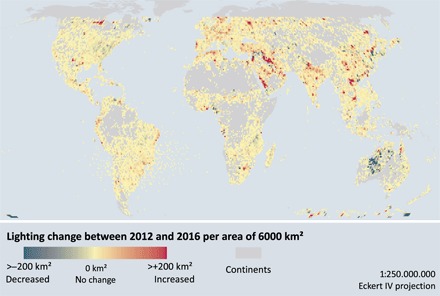
Fig. 2. Absolute change in lit area from 2012 to 2016.

Pixels increasing in area are shown as red, pixels decreasing in area are shown as blue, and pixels with no change in area are shown as yellow. Each pixel has a near-equal area of 6000 ± 35 km2. To ease interpretation, the color scale cuts off at 200 km2, but some pixels had changes of up to ±2000 km2.
