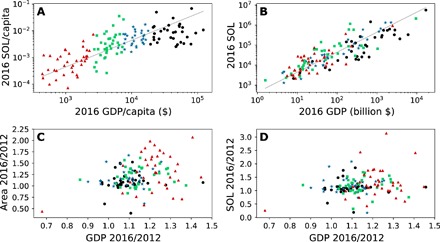
Fig. 4. Relationships between light and economic parameters.

(A) National sum of lights (SOL) per capita compared to per capita GDP, (B) sum of lights versus national GDP, (C) change in lit area from 2012 to 2016 versus change in GDP (one outlier not shown), and (D) change in sum of lights from 2012 to 2016 versus change in GDP. Colors and symbols indicate per capita GDP in 2016: <$2000 (red triangles), $2000 to $6000 (green squares), $6000 to $17,000 (blue stars), and >$17,000 (black circles). Solid lines show an extrapolation based on the value of the median country.
