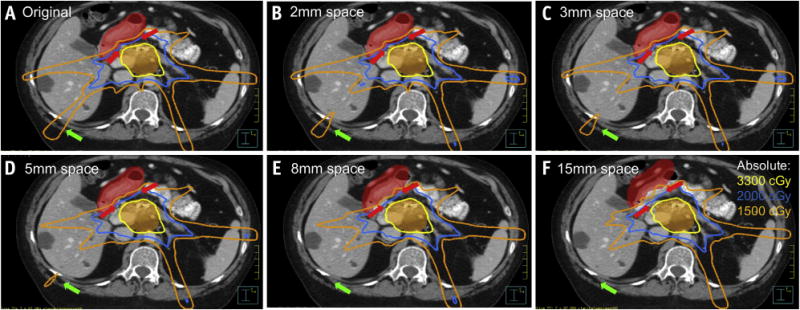
Fig. 5.

The effect of serially increased spacing (red arrowheads) of the proximal duodenum (red shaded) from the planning target volume (orange shaded). (A) Baseline scan and plan shown, with subsequently increased spacing of proximal duodenum from PTV of (B) 2 mm, (C) 3 mm, (D) 5 mm, (E) 8 mm, and (F) 15 mm. Isodose lines of 33 Gy (yellow), 20 Gy (blue), and 15 Gy (orange) are displayed for each of the simulated plans, with serially increased conformality of the low-dose region (green arrow) with a reduced dose to the liver and chest wall.
