
Fig. 6.
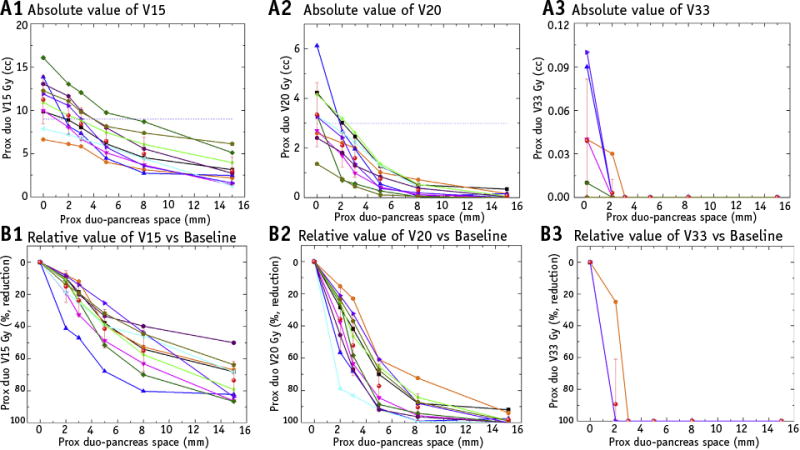
The comparison of absolute and relative values of duodenum in volume receiving 15 Gy (V15), volume receiving 20 Gy (V20), and volume receiving 33 Gy (V33) from 10 sample patient stereotactic body radiation therapy plans, each with serially increasing space between the proximal duodenum and pancreas. The blue dash line represents the clinical limits of endpoints in our institution (duodenum V15 <9 cm3,V20 <3 cm3,V33 <1 cm3). The red star dots with error bar indicate the mean value of corresponding endpoints at each separation distance. As the simulated separation from gel injection increased, both the duodenum V15, V20, and V33 absolute and relative volumes decreased.