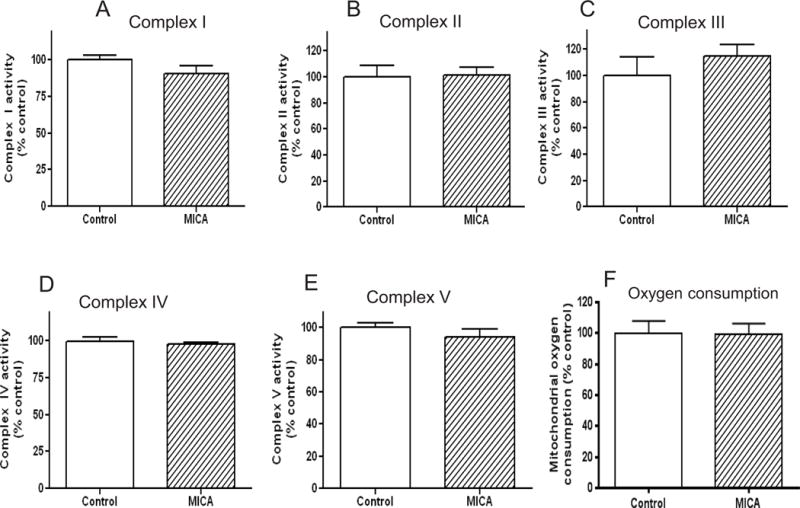
Fig. 3.

Effects of MICA diet on activities of mitochondrial electron transport chain components (panels A to E for complexes I to V, respectively) and mitochondrial function. Activities were measured as previously described [53, 55]. Panel F shows mitochondrial oxygen consumption between control and MICA diet. For A to E, values are mean ± SEM from 5 rats per group; for F, values are mean ± SEM from 3 rats per group.
