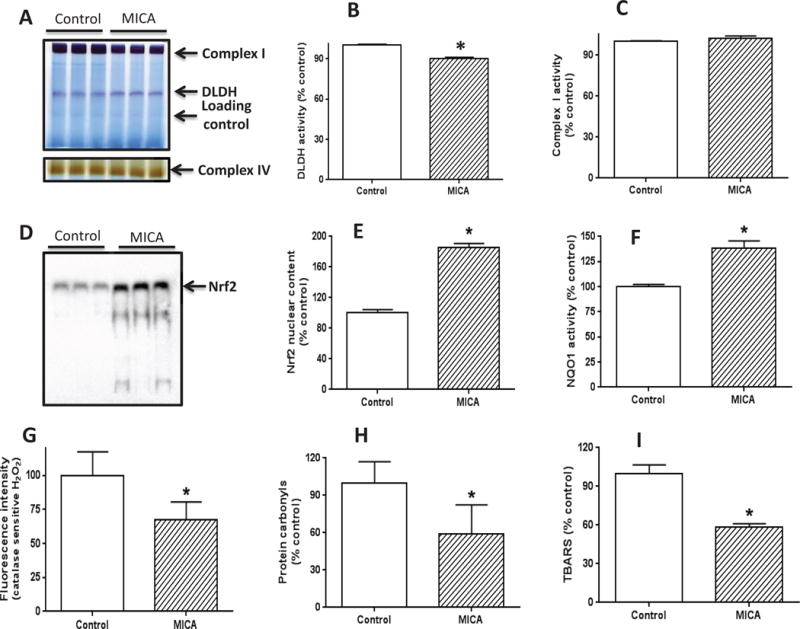
Fig. 6.

Measurement of DLDH activity, Nrf2 signaling pathways, and oxidative stress after brain ischemia reperfusion following MICA feeding. (A) BN-PAGE analysis of DLDH and complex I activities (upper panel) and complex IV activities (lower panel); (B) Densitometric quantification of DLDH activity derived from (A); (C) Densitometric quantification of complex I activity derived from (A). For both B and C, the densitometric intensity was normalized against the indicated Coomassie blue band as loading control. (D) nuclear content of Nrf2 assessed by gel shift analysis; (E) Densitometric quantification of nuclear Nrf2 content derived from (D); (F) NQO1 activity measured spectrophotometrically; (G) Fluorescence intensity reflecting catalase-sensitive hydrogen peroxide content; (H) Mitochondrial protein carbonyl content determined by biotin-hydrazide labeling followed by Western blot analysis. (I) Lipid peroxidation measured by TBARS; (*p<0.05, mean ± SEM, n=3 for each group).
