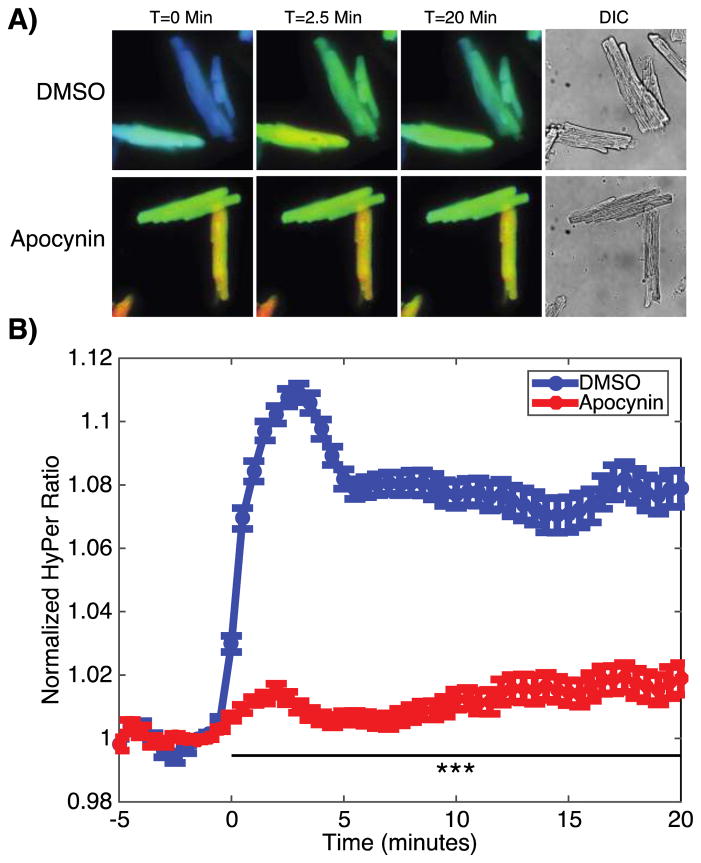
Figure 4. Direct imaging of insulin-promoted changes in intracellular H2O2 concentrations.
A) Representative ratiometric images of cardiac myocytes isolated from mice injected with an AAV9 viral vector carrying the H2O2 biosensor HyPer. Cardiac myocytes were pretreated with either vehicle (DMSO) or apocynin (500 μM) and stimulated with insulin (10 nM) at time=0. Ratiometric images are displayed with a color lookup table that extends linearly across increasing ratios from blue to red. B) Pooled data from HyPer-expressing cardiac myocytes stimulated with insulin at t=0 minutes with or without apocynin pretreatment. n=5 coverslips per condition with 20–40 cells per coverslip isolated from 3 mice total. *** indicates p<0.001 compared to DMSO.

