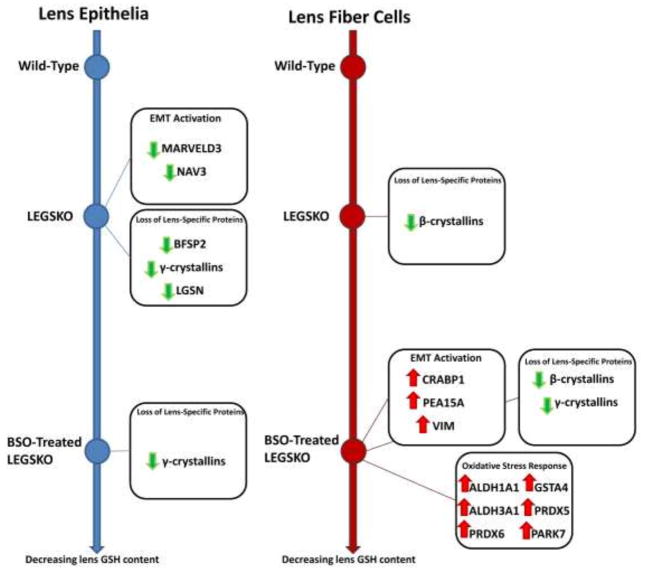
Figure 3. Schematic Representation of Major Trends in the GSH-Deficient Lens Proteome.
Color and direction of arrows indicate direction of regulation change. Green arrows = downregulation, red arrows = upregulation. Line graphs represent lenticular GSH content which decreases from top to bottom of the figure.

