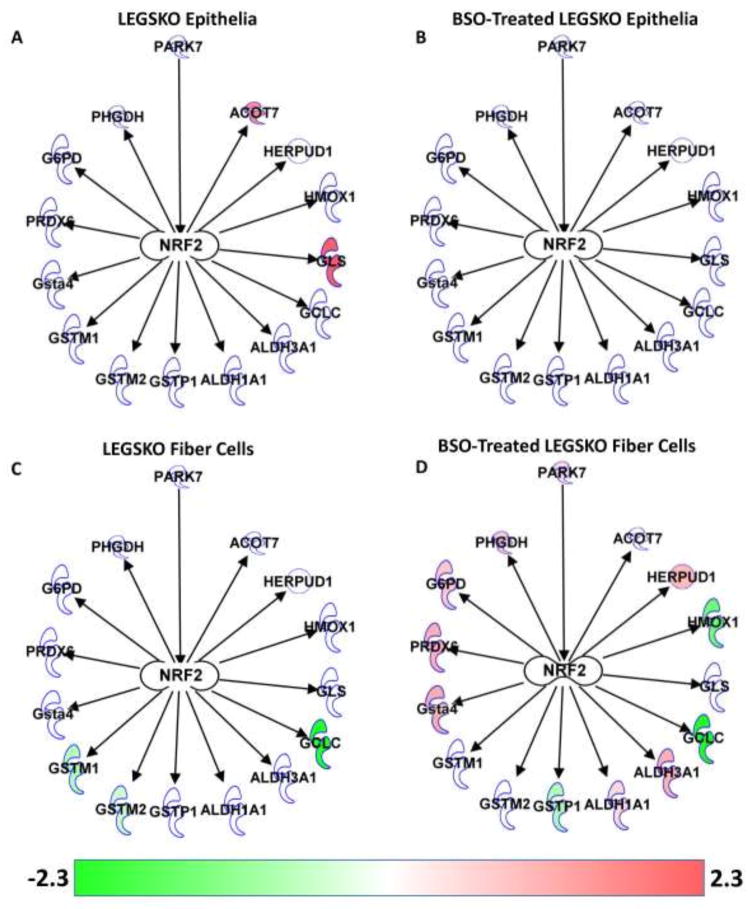
Figure 5. NRF2-Regulated Protein Expression Changes.
(A) LEGSKO lens epithelia. (B) BSO-treated LEGSKO lens epithelia. (C) LEGSKO lens fiber cells. (D) BSO-treated LEGSKO lens fiber cells. Arrows indicate activation. Color indicates fold change of gene relative to WT, as indicated by the color bar. Diagram created using Ingenuity Pathway Analysis software (Qiagen, Hilgen, Germany).

