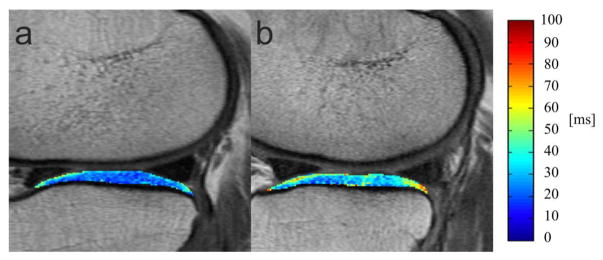
Fig. 2.
Two representative sagittal T2 color maps of the lateral tibia cartilage of the right knee overlaid with the first-echo images of the MSME sequence. (A) 61-year old woman without injury (BMI 31.7, KL 1) from the control group and (B) 67-year old woman with injury (BMI 31.5, KL 1) from the case group. Blue color demonstrates low, while red color demonstrates high cartilage T2 values. Lateral tibia cartilage of uninjured subject showed lower T2 relaxation time (22.18 ms) compared to the subject with injury (37.31 ms).

