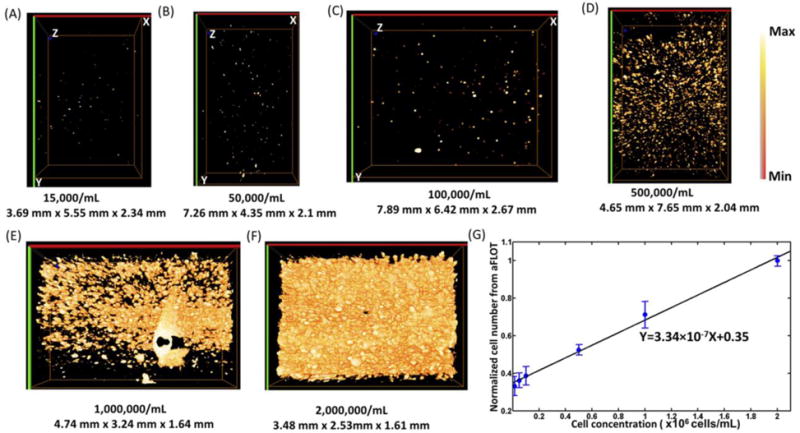
Fig. 1.

(A) 3-D aFLOT reconstruction images of orange-labelled fibroblast cells 15,000/mL (A), 50,000/mL (B), 100,000/mL (C), 500,000/mL (D), 1,000,000/mL(E), 2,000,000/mL (F), in the GelMA gel. (G) Normalized averaged cell numbers from aFLOT as a function of true cell concentration in the gel. The “Max” in the colormap is the maximum value in the image and “Min” represents the value: (Background + (Max-Background)/2).
