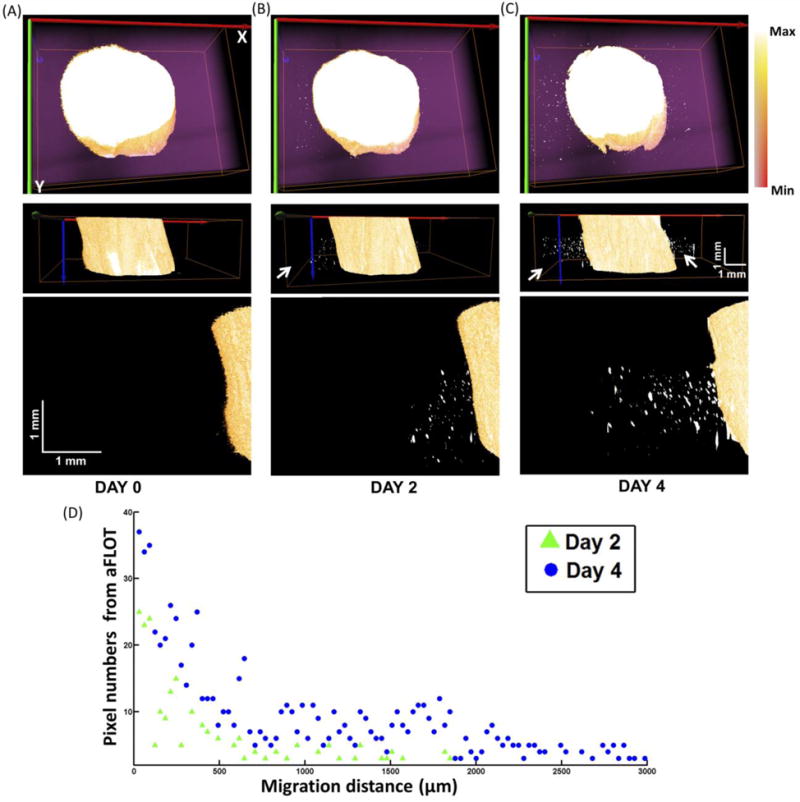
Fig. 4.

Top view, side views and zoomed in side views to the left of the 3-D aFLOT reconstructed migration model at day 0 (A), day 2 (B) and day 4 (C). The Max in the colormap is the maximum value in the image and Min represents the value: (Background + (Max-Background)/2). The migrated and proliferated cells are indicated by the white arrows. (D) Cells (Pixels) numbers was plotted over migration distance at day 2 and day 4.
