
Fig. 5.
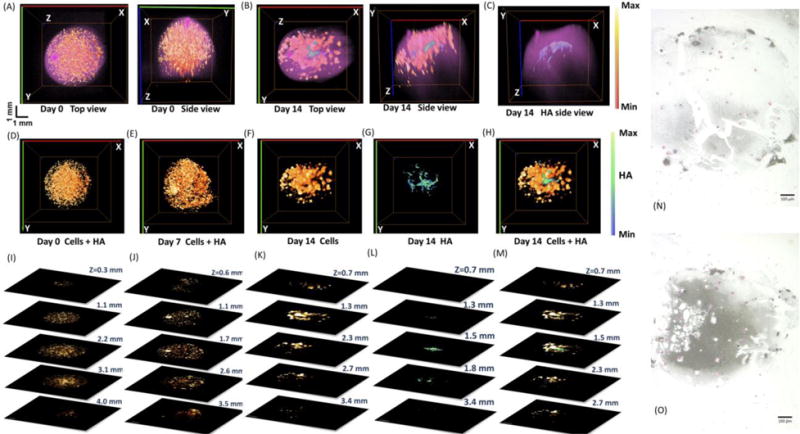
Top and side views of the 3-D aFLOT reconstructed hMSCs (orange-red) and HA (green-blue) distribution superimposed with the bead surface (pink) in the alginate beads at day 0 (A) and day 14 (B). (C) Side view of the 3-D aFLOT reconstructed HA distribution (green-blue) superimposed with the bead surface (pink) in the alginate beads at day 14. (D)–(F) Top views of the 3-D aFLOT reconstructed hMSCs (orange-red) at day 0 (D), day 7 (E) and day 14 (F). (G) Top view of the 3-D aFLOT reconstructed HA (green-blue) distribution at day 14. (H) Top views of the 3-D superimposed aFLOT reconstructed hMSCs (orange-red) and HA (green-blue) distribution in the alginate beads at day 14. (I)–(M) Corresponding XY cross sections of the 3-D aFLOT reconstructed alginate beads at different depths to (D)–(H). Scale bar: 1 mm. (N)–(O) Von Kossa staining of alginate scaffold at Day 7 (N) and Day 14 (O), respectively. Mineralization is stained in black, while cell nuclei appear in pink. (3D renderings of the reconstructed alginate beads in Supplementary Video 3–5).