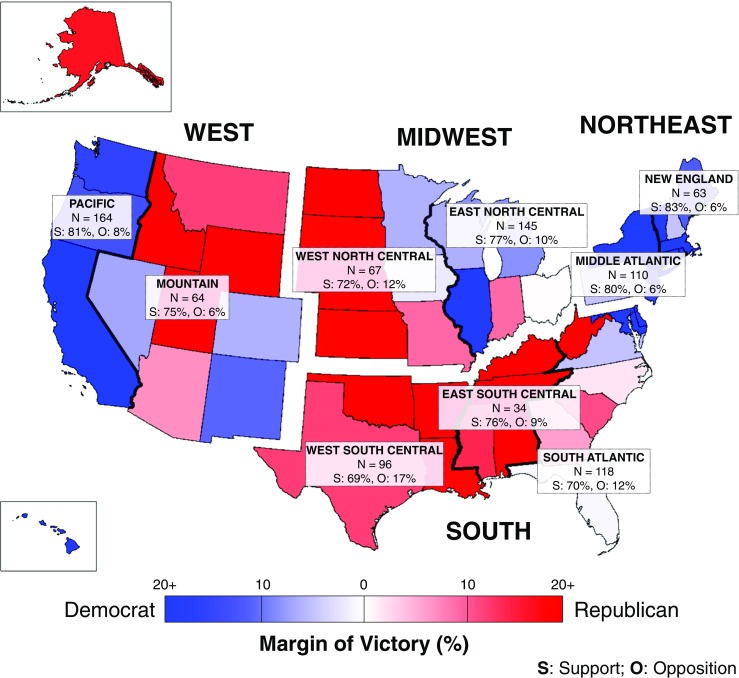
Fig. 1.

Percentage of respondents who either support (S) or oppose (O) physicians helping transgender people have biological children according to US census region. This map denotes the US census regions and the political party voted for by each state by average margin of victory over the last three presidential elections (2008, 2012, and 2016). States that leaned Republican are shaded red; states that leaned Democratic are shaded blue. Deeper shades of each color indicate a larger average margin of victory, with > 20% margin represented as the deepest shades. The no. (%) of respondents in each census region who support and oppose physicians being able to help transgender people have biological children are indicated
