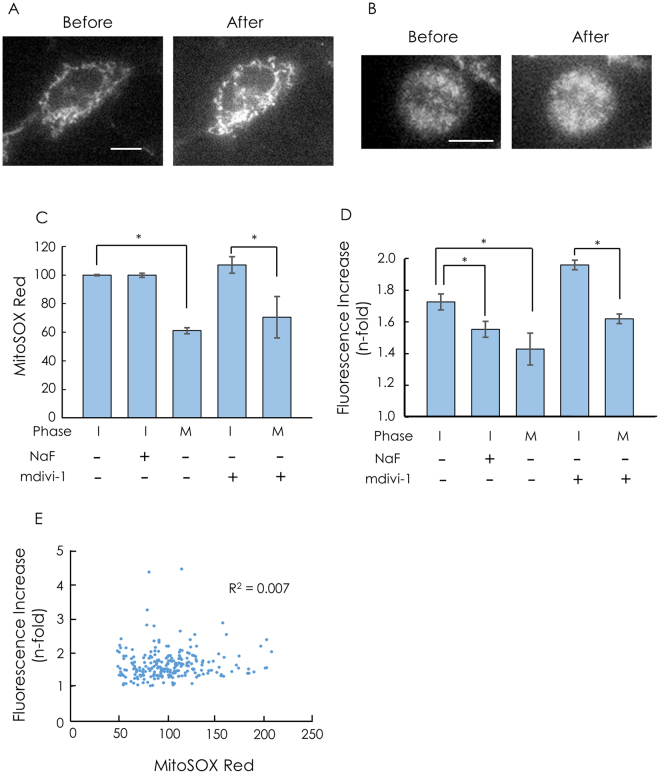
Figure 4.
ROS production in cells during cell division. (A,B) Fluorescence images of MitoSOX Red in C6 cells before and after the addition of antimycin A. (A) interphase, (B) metaphase. Bar, 10 μm. (C) MitoSOX Red fluorescence in cells. The fluorescence was integrated over a whole cell. I, interphase; M, metaphase. The average of the integrated fluorescence of cells at interphase was normalized to 100. When glycolysis was inhibited, C6 cells were incubated with 5 mM NaF in HBS without glucose prior to staining with MitoSOX Red. Cells were incubated with 20 μM mdivi-1 for 6 h at 37 °C in the CO2 incubator prior to the measurements. Data are presented as means ± S.E.M. n = 13–54. *P < 0.05. (D) Increase in MitoSOX Red fluorescence by the addition of antimycin A. The increase is denoted as the ratio of the fluorescence 5 min after the addition of 1 μM antimycin A to the fluorescence before the addition of antimycin A. Data are expressed as means ± S.E.M. n = 13–54. *P < 0.05. (E) The correlation between MitoSOX Red fluorescence before the addition of antimycin A and the increase in MitoSOX Red fluorescence by the addition of antimycin A. MitoSOX Red fluorescence and the increase by the addition of antimycin A were measured for the same cells at interphase. n = 228. R 2, squared correlation coefficient.

