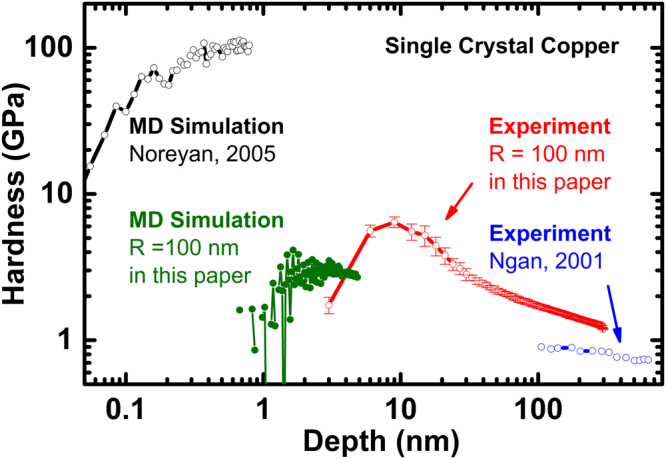
Figure 1.

Comparison of numerical and experimental results of hardness in single crystal Cu, based on available literature and the results with tip radius of 100 nm obtained in this paper. The hardness trends are opposite in nano-scale (black) and micro-scale (blue). The simulation result (black) is two orders higher than the experiment one (blue). There is a gap in simulation and experiment between 1 nm to 100 nm from literature. The simulation (green) and experiment (red) results in this paper are in the same order and the trends are similar to each other, the hardness curves all go up then go down as the indentation depth deceases.
