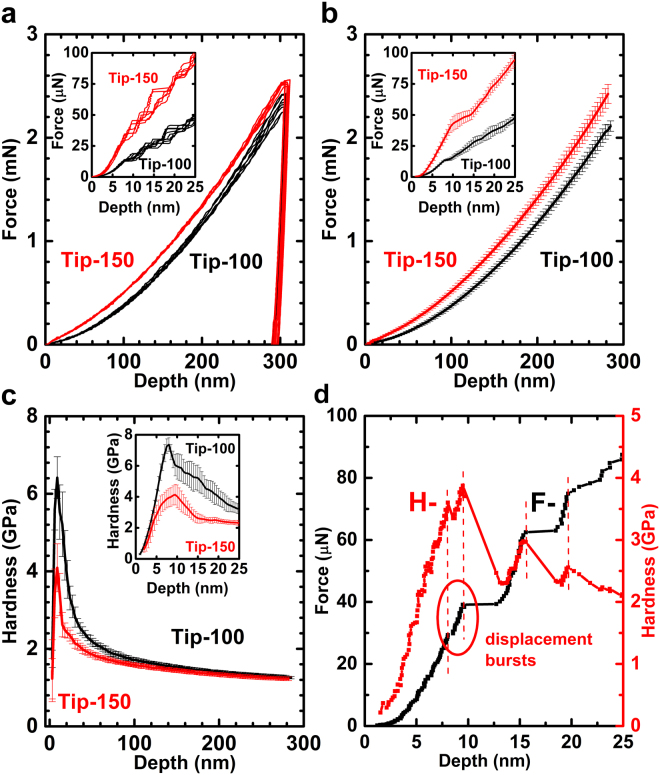
Figure 2.
Experiment results of indentation on Cu. (a) Force-depth curves obtained using two indenters with 100 nm and 150 nm tip radius, respectively. The repeatability of the experiments is good when indentation depth is within 10 nm and over 25 nm. In the range of 8–25 nm, the curves separate due to displacement “bursts” patterns in the curves. The 150 nm tip loading curves are higher compare to these of 100 nm tip. (b) Average and error bar of force-depth curves from Tip-100 and Tip-150 (n = 18 tests) result in the same conclusion for the repeatability of the experiments (error bar: s.d.) and the influence of the tip radius. (c) Hardness curves of the Cu samples. The hardness goes up then goes down as the indentation depth deceases, the transition occurs in the range of 8–10 nm, and peak value can be observed in this range too. Hardness value is higher for Tip-100, the corresponding depth to the hardness peak is lower than that of Tip-150. The effect of the tip radius abates when the indentation depth is over 100 nm. (d) Displacement “bursts” in the loading curves. They correlate to each drop in hardness curve.

