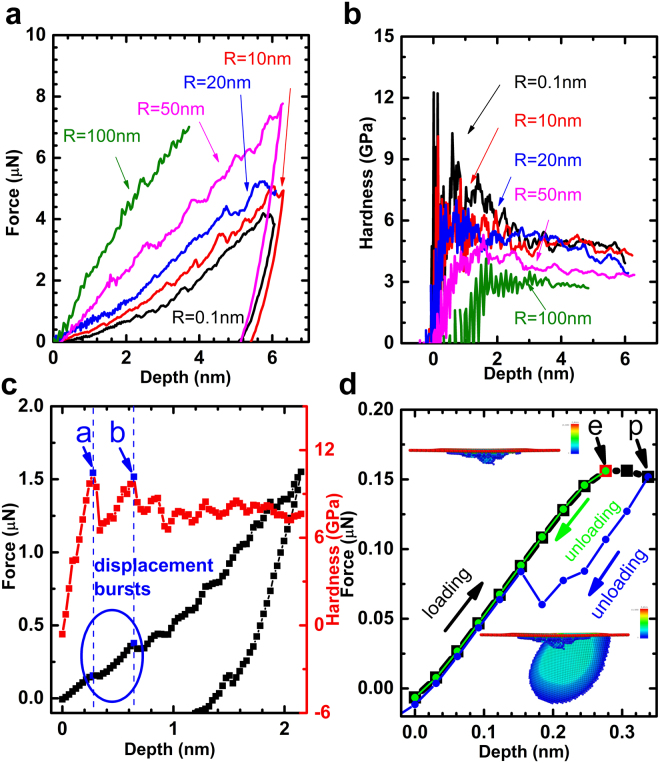
Figure 3.
Simulation results of indentation on Cu. (a) Force-depth curves from MD simulations of 0.1, 10, 20, 50 and 100 nm radius tip. The load is higher with larger tip radius. (b) Hardness curves of the Cu. The hardness is lower with larger tip radius. (c) Displacement “bursts” patterns in the loading curves for the case of R = 10 nm at 0 K. This is similar to that from the experiments in Fig. 2d, and each drop of hardness value coincides with a burst in displacement curve. (d) A close look at the loading and unloading curves of Fig. 3c at shallow depth, and CSP distributions after the indenter is retrieved from the sample at step point e and p. The loading and unloading curves converge with each other before step point e, and CSP map shows the distortion of the lattice is not great and after the indenter is removed, the lattice will recover to origin state; and then a hysteresis loop emerges when loading beyond step point e, indicating the deformation is not reversible. CSP map shown stacking fault and dislocation initiate, and the lattice cannot be restored to its origin state after the indenter retrieves from the sample.

