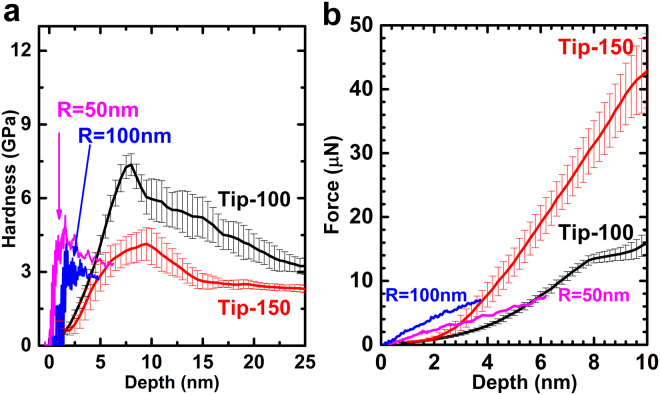
Figure 4.
Comparison of the hardness and force results from experiment and simulation. (a) Hardness curves from Tip-100 and Tip-150 (experiment) is higher than those from R = 50 nm and 100 nm (simulation), and the depth to reach the hardness peak is larger as well. For the same tip radius (R = 100 nm), hardness from experiment is twice of that from the simulation. However, larger tip radius results in lower hardness and larger depth to reach the hardness peak is mutual in experiment and simulation. (b) Force-depth curves from experiment and simulation. Force curve from experiment is lower compares to that from the simulation. For the same tip radius (R = 100 nm), force from experiment is twice of that from the simulation. The influence of the tip radius is the same in both approaches.

