Figure 5.
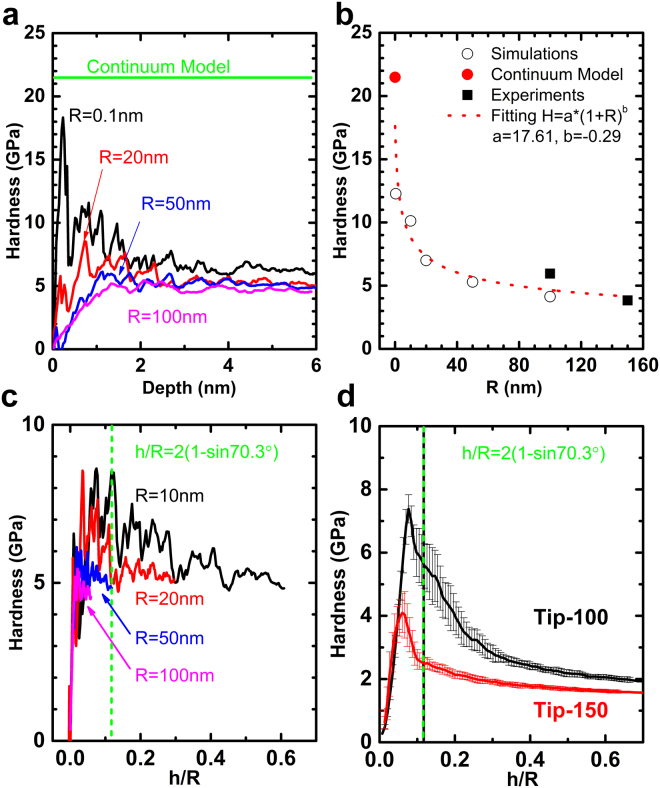
The influence of tip radius to the hardness. (a) Hardness curves from simulation and comparison with the theoretical hardness of conical indenter indents into elastic material. This value from continuum model stands for the upper limit of the hardness peak, equivalent to the result of R = 0 nm. (b) Hardness peak value over the tip radius. The results from experiment (black square dots), simulation (black round circles) and analytical (red round dot) seem follow the same trend, a power-law fitting curve (red dotted-line) to the data is plotted in the figure. The simulation and experiment results overlap at R = 100 nm. (c) The hardness curves from simulation (at 0 K) in terms of relatively depth (h/R). When h/R is small, the curves coincide with each other. The hardness transition occurs in spherical part of the indenter, as the hardness peaks are on the left side of the green line which indicates the boundary of spherical and conical part of the indenter. (d) The hardness curves from experiment in terms of relatively depth (h/R). Same observations can be found as these from the simulation, although the hardness and depth for the transition are higher.

