
Fig. 4.
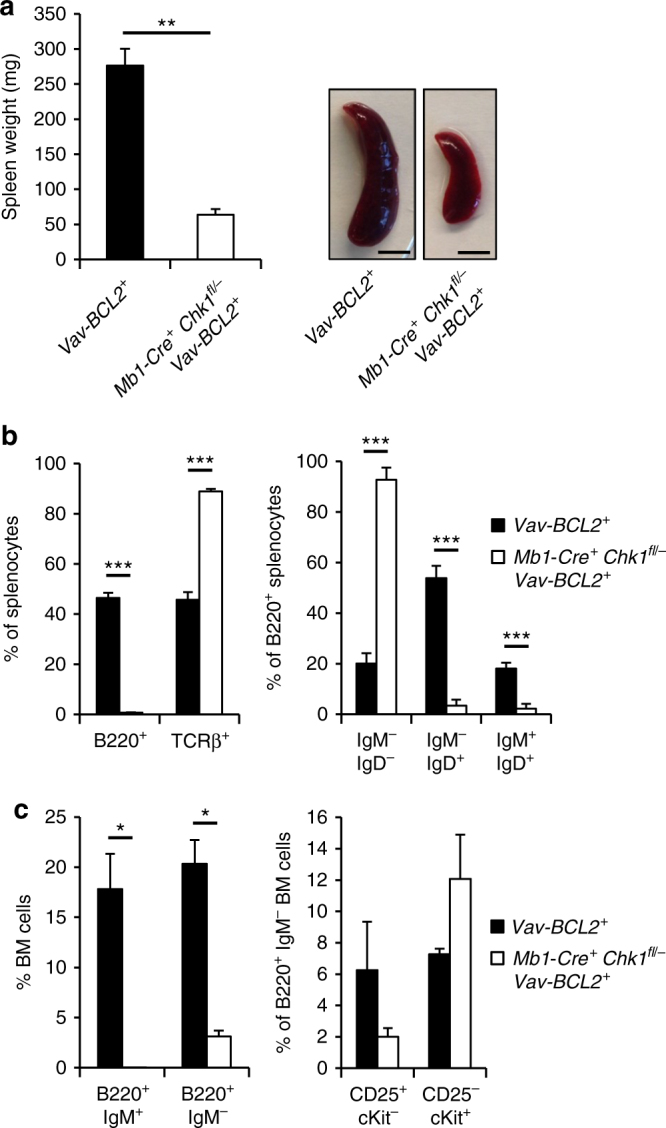
Inhibition of BCL2-regulated cell death fails to restore B cell development in the absence of CHK1. a Spleen weight and representative pictures (scale bar = 5 mm) of spleens of 6–8 weeks old mice of the indicated genotypes. b Relative distribution of splenic B cells (B220+) and T cells (TCRβ+) as well as different B cell subsets based on IgM and IgD expression of the indicated genotypes is shown. c Distribution of bone marrow B cell subsets. Bars represent means of n = 4 Vav-BCL2+ and n = 5 Mb1-Cre + Chk1 fl/− Vav-BCL2+ animals ± S.E.M. *p < 0.05, **p < 0.01, ***p < 0.001 using unpaired Student´s t test