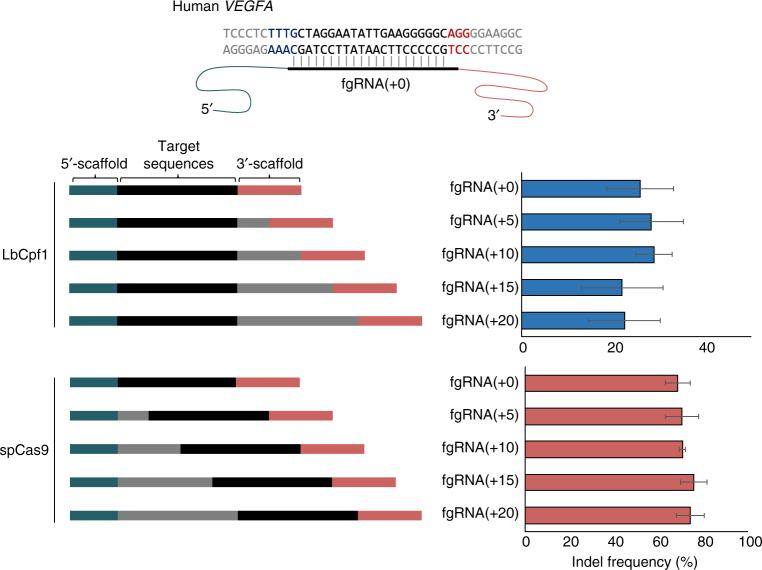
Fig. 3.
Endogenous indel frequencies according to the lengths of the target sequences between the 5′- and 3′-scaffolds. Top, human VEGFA target sequences and fgRNAs are shown. PAM sequences of LbCpf1 (TTTG) and spCas9 (AGG) are colored blue and red, respectively. The mimetic construct of fgRNAs is described; blue–green and pink colors represent 5′-scaffolds of LbCpf1 and 3′-scaffolds of spCas9, respectively. Bottom, endogenous indel frequencies are shown based on different lengths of fgRNAs, as measured using targeted deep sequencing. Each target sequence is listed in Supplementary Table 1. Error bars indicate s.e.m. (n = 2)

