Fig. 6.
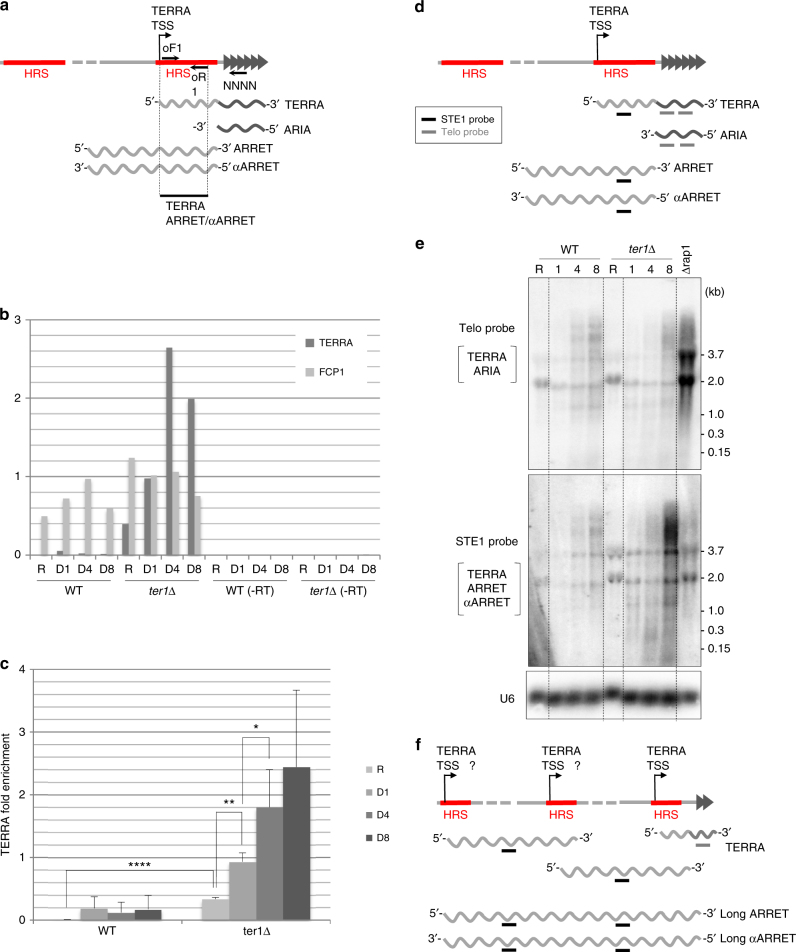
TERRA accumulates in quiescence. a Schematic representation of the S. pombe telomeric transcripts. Subtelomeric region is shown as a gray line and telomeric repeats represented by dark gray triangles. Oligonucleotides used for RT-qPCR (oF1 and oR1, and random hexanucleotide NNNN), TERRA transcription start site (TSS), and HRS are indicated. b RNA from telomerase positive (WT) and ter1Δ cells were extracted in proliferative (R) and in quiescent (D1–D8) cells. RNA levels were determined by RT-qPCR using a random hexanucleotide primer followed by qPCR with specific oligonucleotides for TERRA and control Fcp1. A control experiment was performed without reverse transcription step (−RT). c TERRA fold enrichment was determined as the ratio of TERRA over Fcp1 RNA levels. Error bars indicate the SEM from three independent experiments; P-values are calculated from two-tailed t-test (*P = 0.0355; **P = 0.001; ****P < 0.001). d Schematic representation of the S. pombe telomeric transcripts. The STE1 and Telo probes used for the northern blots are indicated by black and gray lines, respectively. The TERRA/ARIA and TERRA/ARRET/αARRET transcripts are detected with Telo and STE1 probes, respectively. e Northern blot analysis in telomerase positive (WT), rap1Δ, and ter1Δ cells. RNA was extracted in proliferative (R) and in quiescent (D1, D4, and D8) cells. The Northern blot was hybridized with a Telo, STE1 and U6 (loading control) probes. f Schematic representation of transcription in ter1Δ quiescent cells. Duplication of TERRA TSS in STEEx may lead to accumulation of new transcripts

