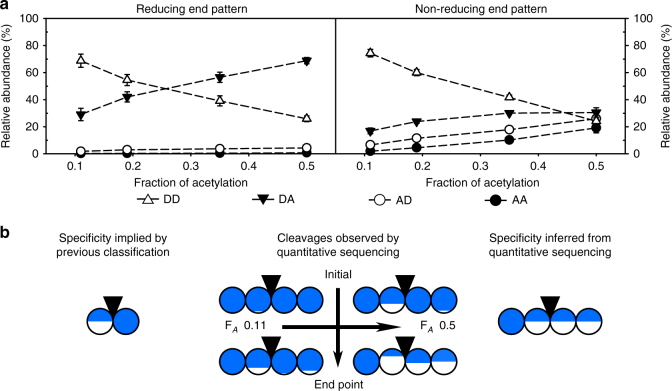
Fig. 2.
Specificity of the representative class I chitosanase CSN-174 inferred from its products. (a) The patterns of acetylation of the two terminal sugar units were analyzed for different FA of the substrates by quantitative sequencing of the products at the endpoint of enzymatic hydrolysis. The molar fractions of all possible diads (DD, DA, AD, and AA) are shown. (b) The specificity of class I chitosanases implicated by the established qualitative classification system compared to the specificity of CSN-174 (a model class I chitosanase) inferred from the cleavages observed by the quantitative sequencing of its products’ sugar moieties. Diad frequencies at the early time points of enzymatic hydrolysis are taken from Supplementary Table 5. Detailed oligomer compositions are shown in Supplementary Table 1. The circles are divided according to the percentage of the relative abundances (molar fractions) of GlcN (blue) and GlcNAc (white) at the two corresponding subsites, left, (−2) and (−1), and right, (+1) and (+2), of the catalytic cleavage site (indicated by a black inverted triangle). The mean values with standard deviations of at least three independent measurements of three independent enzyme batches are shown (Supplementary Tables 1 and 5)

