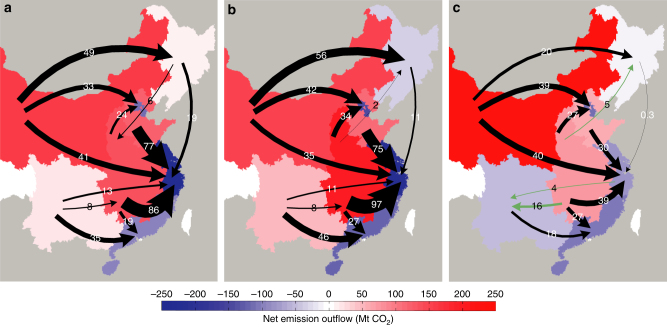
Fig. 3.
Changes in emission flow patterns within China. a Net emission outflows in 2007, b Net emission outflows in 2010, c Net emission outflows in 2012. The sizes of arrows correspond to the amount of net emission flows, and green arrows mean that net emission outflows reversed between 2007 and 2012. Mt CO2 means million tonnes of carbon dioxide. The net emission flows to eastern coastal provinces declined from 2007 to 2012, and Southwest and Northeast China shifted from being net emission exporters to net emission importers

