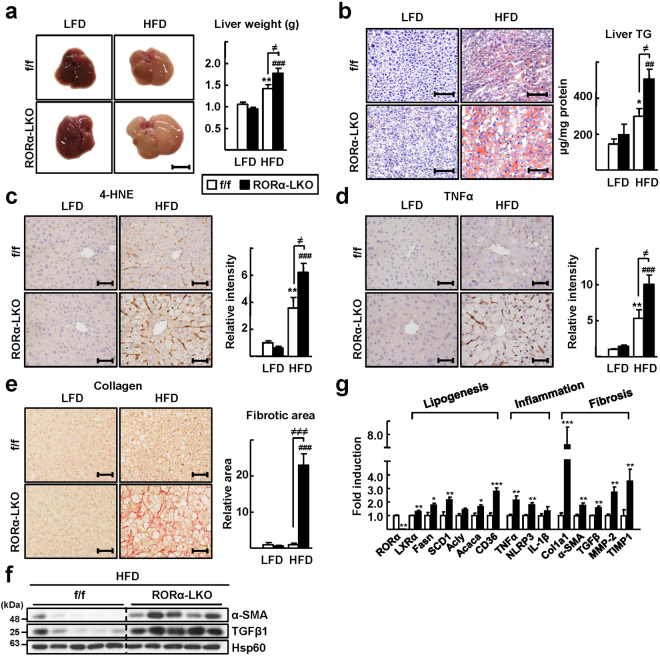
Figure 1.
Liver-specific KO of RORα enhances susceptibility to HFD-induced steatohepatitis. (a) Six week-old RORα-LKO and RORαf/f mice were fed with either LFD or HFD for 12 weeks. Representative images of livers and the liver weights of experimental mice at the end of experiments. Scale bar: 1 cm. Values represent mean ± SEM (n = 7–9). ** P < 0.01 vs LFD-fed RORαf/f, ### P < 0.001 vs LFD-fed RORα-LKO, ≠ P < 0.05 vs HFD-fed RORαf/f. (b) Oil red O staining of liver sections and hepatic TG levels. Scale bar: 100 μm. Representative images are shown. Values represent mean ± SEM (n = 7–9). * P < 0.05 vs LFD-fed RORαf/f, ## P < 0.01 vs LFD-fed RORα-LKO, ≠ P < 0.05 vs HFD-fed RORαf/f. (c,d) Histological staining of 4-HNE (brown) and TNFα (brown). Scale bar: 50 μm. Representative Images of liver sections from the RORαf/f and RORα-LKO mice were presented. Relative intensities were quantified using ImageJ. Values represent mean ± SEM (n = 6–8). ** P < 0.01 vs LFD-fed RORαf/f, ### P < 0.001 vs LFD-fed RORα-LKO, ≠ P < 0.05 vs HFD-fed RORαf/f. (e) Sirius red staining in the liver sections for detection of collagen deposition (red, left). Scale bar: 50 μm. Fibrotic area in the liver sections was analyzed using ImageJ (right). Values represent mean ± SEM (n = 6–8). ### P < 0.001 vs LFD-fed RORα-LKO, ≠≠≠ P < 0.001 vs HFD-fed RORαf/f. (f) The protein levels of α-SMA and TGFβ1 were analyzed by western blotting in the liver tissues (n = 5). The original blots are shown in Supplementary Fig. S7. (g) The mRNA levels of factors related to lipogenesis, inflammation, and fibrosis were measured by qRT-PCR in the liver tissues. LXRα, Liver X receptor alpha; Fasn, Fatty acid synthase; SCD1, Stearoyl-CoA desaturase 1; Acly, ATP citrate lyase; Acaca, Acetyl-CoA carboxylase; TNFα, tumor necrosis factor alpha; NLRP3, NACHT, LRR and PYD domains-containing protein 3; IL-1β, Interleukin 1 beta; Col1a1, collagen Type I; α-SMA, alpha-smooth muscle actin; TGFβ, transforming growth factor β; MMP-2, matrix metalloproteinase-2, and TIMP1, TIMP metallopeptidase inhibitor 1. Values represent mean ± SEM (n = 7–9). * P < 0.05, ** P < 0.01, and *** P < 0.001 vs HFD-fed RORαf/f.

