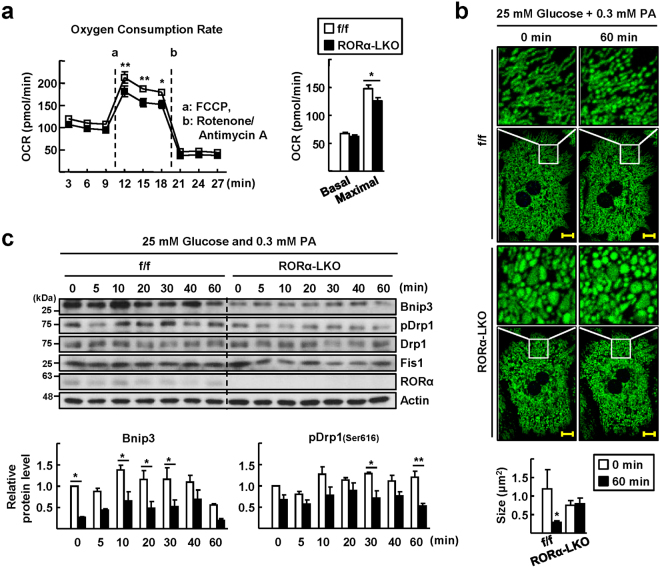
Figure 3.
Mitochondrial fission is impaired in the hepatocytes of RORα-LKO mice. (a) The basal OCR and maximal respiration of control and RORα-LKO primary hepatocytes. a, b refer to the time course of adding FCCP, a inducer of maximal respiration, and antimycin A/rotenone, respectively (left). Data presented as mean ± SEM (n = 3). * P < 0.05 and ** P < 0 0.01 vs RORα-LKO. The basal OCR, and maximal respiration were calculated based on data in left panel (right). Data presented as mean ± SEM. * P < 0.05 vs RORα-LKO. (b) Hepatocytes were infused by ad-COX8a-GFP to tag mitochondria for visualization. Hepatocytes were cultured in low nutrient condition (5.5 mM glucose) for 2 h, and then exchanged to the media containing 25 mM glucose and 0.3 mM palmitic acid. Photos were taken by real-time confocal microscopy. Representative time-lapse images of the mitochondrial morphology are shown (upper). Scale bar: 10 μm. The average mitochondrial size was quantified using ImageJ (lower). Data presented as mean ± SEM. * P < 0.05 vs 0 min (RORαf/f). (c) Cell lysates were obtained at the indicated time after media change and the levels of proteins associated with mitochondria dynamics were analyzed by western blotting (upper). Band intensities of Bnip3 and pDrp1 were quantified using ImageJ and normalized to that of actin (lower). Data presented as mean ± SEM. * P < 0.05 and ** P < 0.01 vs RORα-LKO (n = 3). The original blots are shown in Supplementary Fig. S7.

