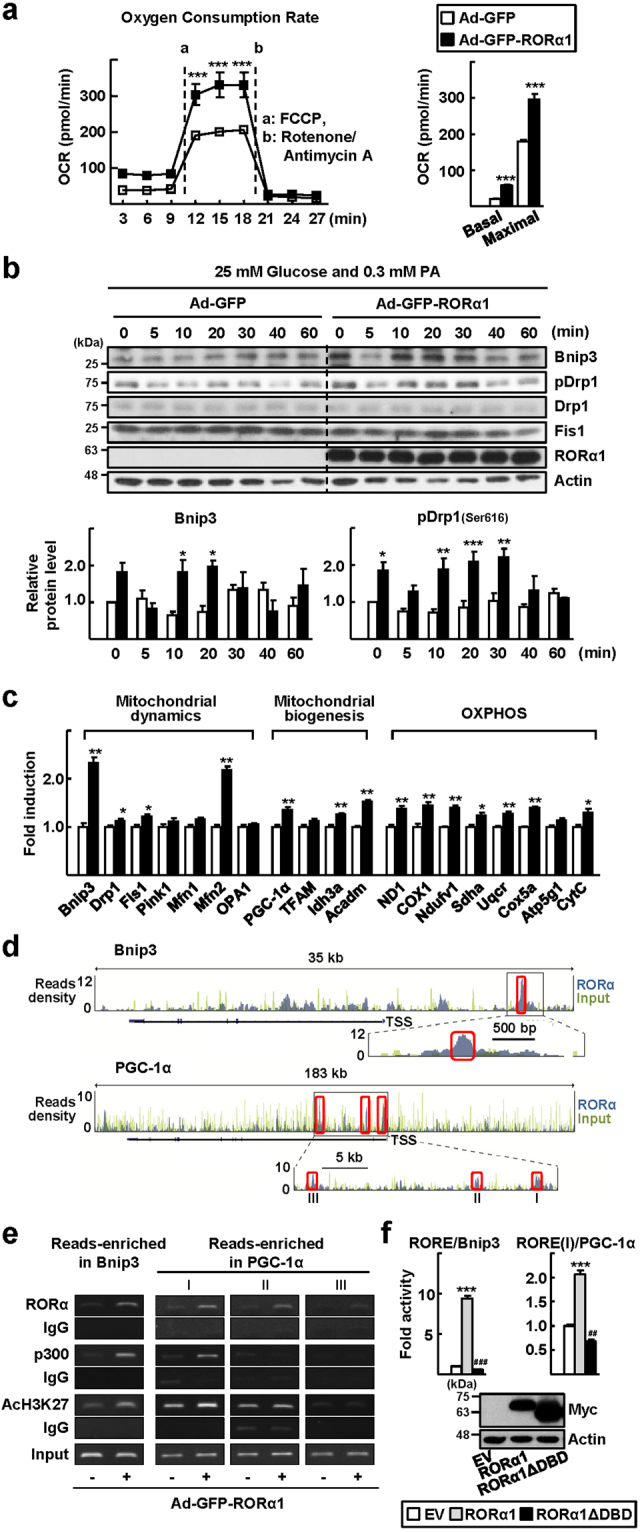
Figure 4.

Overexpression of RORα enhances mitochondrial dynamic response. (a) The basal OCR and maximal respiration of primary hepatocytes infused by either Ad-GFP or Ad-GFP-RORα1. a, b refer to the time course of adding FCCP, and antimycin A/rotenone, respectively (left). Data presented as mean ± SEM. *** P < 0.001 vs Ad-GFP infused hepatocytes (n = 3). The basal OCR, and maximal respiration (right). Data presented as mean ± SEM. *** P < 0.0001 vs Ad-GFP infused hepatocytes. (b) Cell lysates were obtained at the indicated time after media change and the level of proteins associated with mitochondria dynamics were analyzed by western blotting (left). Band intensities of Bnip3 and pDrp1 were quantified using ImageJ and normalized to that of actin (right). Data presented as mean ± SEM. * P < 0.05, ** P < 0.01, and *** P < 0 0.001 vs Ad-GFP infused hepatocytes (n = 3). The original blots are shown in Supplementary Fig. S7. (c) After mouse primary hepatocytes were infected by either Ad-GFP or Ad-GFP-RORα1 for 18 h, the mRNA levels of factors related to mitochondrial dynamics, mitochondrial biogenesis, and OXPHOS were measured by qRT-PCR. The values represented as mean ± SEM. * P < 0.05 and ** P < 0.01 vs Ad-GFP infused hepatocytes (n = 6). (d) The ChIP-seq reads of RORα and liver input control in the genome loci of Bnip3 and PGC-1α are shown in ChIP-seq tracks. Boxes indicate the regions that RORα signals are significantly enriched (Bnip3, chr7 146111103–146111273; PGC-1α I, chr5 51943784–51943954; PGC-1α II, chr5 51937131–51937301; PGC-1α III, chr5 51919125–51919295). A line below the ChIP-seq track represents transcript of the gene. TSS, transcription start site. (e) Primary hepatocytes were infused with either Ad-GFP or Ad-GFP-RORα1 for 18 h. DNA fragments were immunoprecipitated with the anti-RORα, anti-p300, or anti-histone antibodies and then amplified by PCR with specific primers. (f) Chang liver cells were transfected with the RORE/Bnip3-Luc or RORE(I)/PGC-1α-Luc with empty vector or the expression vector encoding Myc-RORα1 or Myc-RORα1 ΔDBD for 24 h (upper). The protein expression of Myc-RORα1 and Myc-RORα1 ΔDBD is shown (lower). The values represented as mean ± SEM. ## P < 0.01 and ***, ### P < 0 0.001 vs empty vector transfected cells (n = 3). The original blots are shown in Supplementary Fig. S7.
