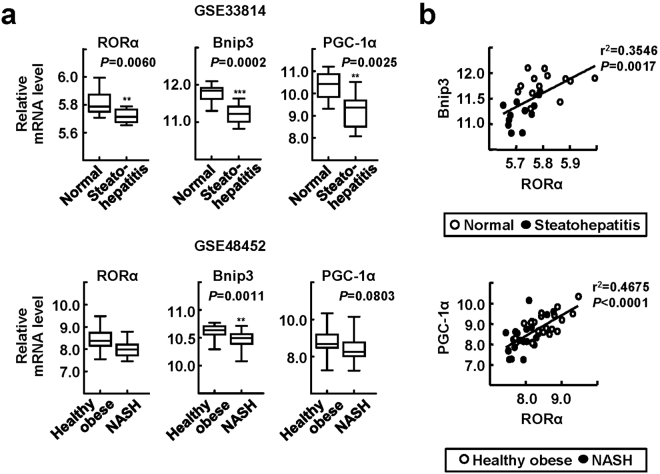
Figure 5.
Expression levels of RORα, Bnip3, and PGC-1α in the livers of patients with steatohepatitis. (a,b) Database-based gene expression analysis was conducted using public datasets obtained from GEO site at the NCBI gene expression (http://www.ncbi.nlm.nih.gov/geo/). The data processed as median-normalized signal intensity value. Significances were analyzed by Mann-whitney U test and the positive correlation coefficient (r2) was calculated by Pearson correlation test. ** P < 0.01, and *** P < 0.001 vs normal or healthy obese (n = 13 (normal) and n = 12 (steatohepatitis) for GSE33814; n = 27 (healthy obese) and n = 18 (NASH) for GSE48452).

