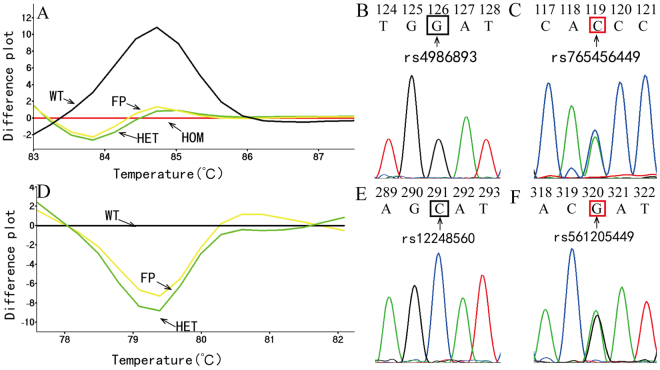
Figure 3.
False positive genotyped samples by HRM assay. (A) The difference curves of the false positive for rs4986893 sample (yellow, FP), wild type sample (black, WT), heterozygous sample (green, HET), homozygous mutant sample (red, HOM). (B) Sanger sequencing results for the target SNP allele of rs4986893 HRM genotyping (green in A), and (C), sequencing results for the false positive sample (yellow in A) showing an alternate variant allele. (D) The difference curves of the false positive for rs12248560 sample (yellow, FP), wild type sample (black, WT), heterozygous sample (green, HET). (E) Sanger sequencing results for the target SNP allele of rs12248560 HRM genotyping (green in D), and (F), sequencing results for the false positive sample (yellow in D) showing an alternate variant allele.

