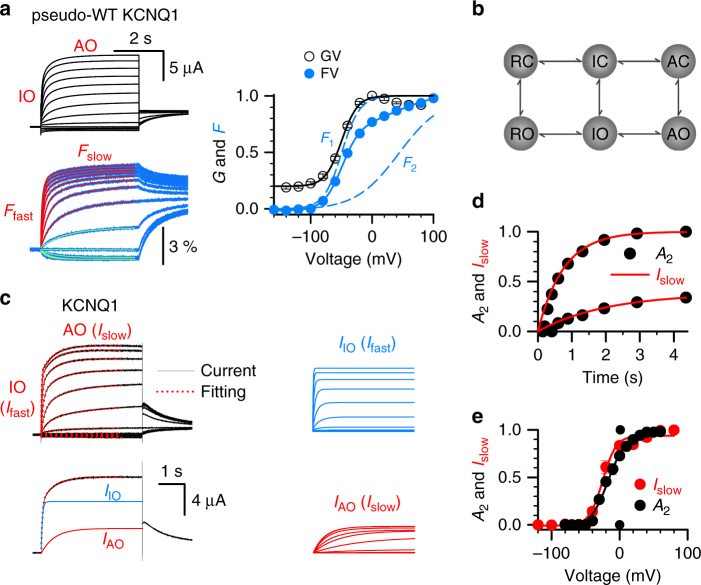
Fig. 2.
Similar time and voltage dependence of hook currents and the AO state of the KCNQ1 channel. a VCF recordings of pseudo-WT (C214A/G219C/C331A) KCNQ1 currents (black) and fluorescence (blue), with voltages from −140–100 mV in 20 mV increments and back to −40 mV to test the tail currents. The fluorescent traces were fitted with a single (green) exponential equation below −50 mV, and a double (red) exponential equation above −50 mV showing both F fast and F slow components. Right panel, the G–V (black, V 50 = −49.12 mV, slope = 13.81) and F–V (blue) relationships with F 1 (V 50 = −49.17 mV, slope = 14.67) and F 2 (V 50 = 43.57 mV, slope = 38.00) components (dotted lines). b The scheme shows the two-step VSD movements R ↔ I ↔ A and channel opening C ↔ O. c Upper left, the WT KCNQ1 currents (black lines) recorded with voltage ranging from −120–80 mV were fitted with a double exponential function (red dots). The tail currents were measured at −40 mV. Lower left, the current (black line) recorded at 40 mV was fit with a double exponential function (red dots). The blue trace is the fast component (I fast) representing the current of the IO state, and the red trace is the slow component (I slow) representing the current of the AO state. Right, I fast and I slow from the currents in upper left. d Dependence of A 2 on the pre-pulse duration (black, from Fig. 1e) and I slow on test pulse duration (red, from Fig. 2c) at −20 and +40 mV. e The dependences of A 2 on pre-pulse voltages (black, from Fig. 1e) and I slow on test pulse voltages (red, from Fig. 2c) of KCNQ1 channels. The voltage for half activation (V 1/2) of A 2–V and I slow–V is −18.2 ± 2.1 mV and −25.0 ± 2.7 mV, respectively. n ≥ 4. Error bars are the SEM. RC resting closed, IC intermediate closed, AC activated closed, RO resting open, IO intermediate open, AO activated open

