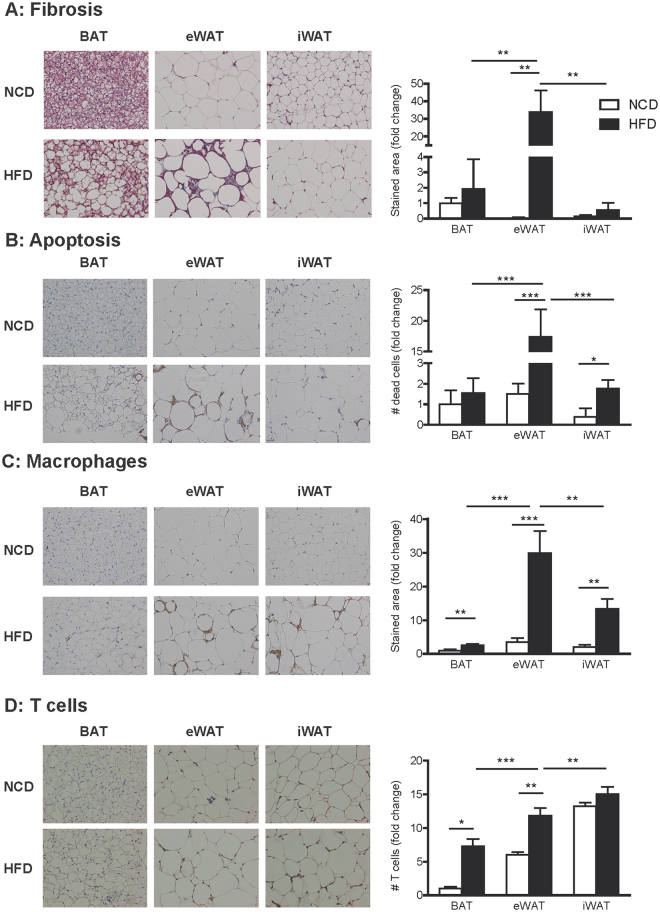
Figure 2.
Increased immune cell infiltration in BAT from obese mice. Histological sections from interscapular BAT, eWAT and iWAT were analysed. (A) Representative images of Masson´s trichrome staining (left). Total collagen was quantified and expressed as the percentage of stained area in blue (right). (B) Representative images of immunohistochemical localization of Caspase-3 (left). The stained area was quantified and apoptosis is expressed as the number of dead cells (right). (C) Representative images of immunohistochemical localization of Mac-2 (left). The stained area was quantified and macrophage infiltration was expressed as a percentage of the stained area (right). (D) Representative images of immunohistochemical localization of CD3 (left). T cell infiltration was expressed through the quantification of CD3 positive cells (right). Arrows point to stained areas. Results are represented as mean ± SEM. n = 8–10; *p < 0.05; **p < 0.01.

