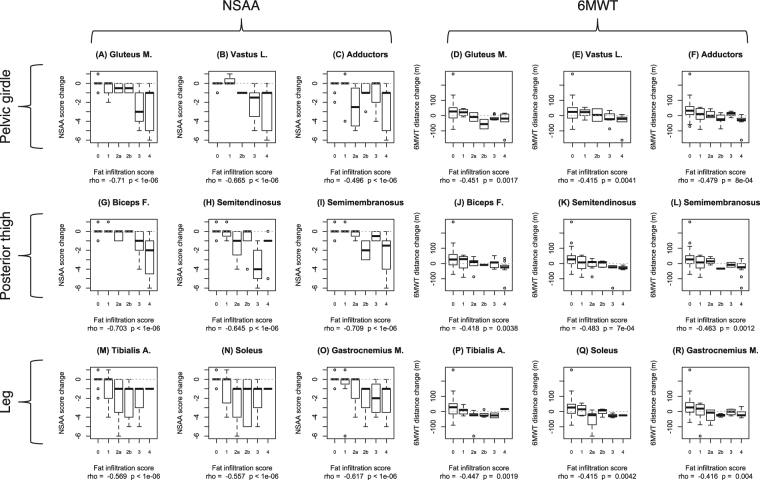
Figure 4.
Boxplots of NSAA score changes and 6MWT distance changes after 1 year by T1w Mercuri score in 9 lower limb muscle. The boxplots illustrate the correlation between T1w MRI findings in each muscle and functional outcome measure change, twelve months after performing the MRI and obtaining baseline functional measures. The nine left hand panels (A–C,G–I, and M–O) correspond to NSAA changes, while the nine right hand panels (D,E,J,K, and P–R) correspond to 6MWT changes correlations. Upper row panels correspond to pelvic girdle and anterior thigh muscles: gluteus maximus (A and D), vastus lateralis (B and E), and adductors (C and F). Middle row panels correspond to posterior thigh muscles: biceps femoris (G and J), semitendinosus (H and K), and semimembranosus, (I and L). Lower row panels correspond to leg muscles: tibialis anterior (M and P), soleus (M and Q), and gastrocnemius medialis (O and R). Correlation parameters (Spearman correlation coefficient “rho” and p-value) are indicated below each graph. The “zero” value on the y axis, corresponding to no change in functional measures, is indicated by a dashed line.

