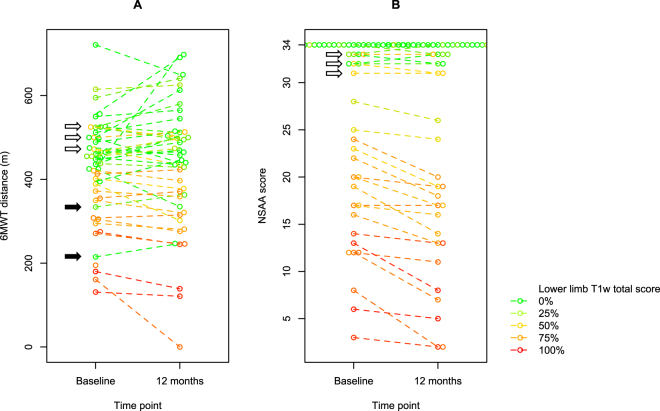
Figure 6.
Beeswarm plots of baseline and 1-year functional measures. Beeswarm plots of (A) 6MWT distances and (B) NSAA scores at baseline (at the time of MRI) and after 1 year. Baseline and 1-year values for each individual participant are linked by a dashed segment. Composite T1w score is color-coded as in the heatmap in a green → yellow → red gradient from 0% to 100% (i.e. total T1w score 0 to 88 out of a possible 88, as a sum of 22 lower limb muscles).

