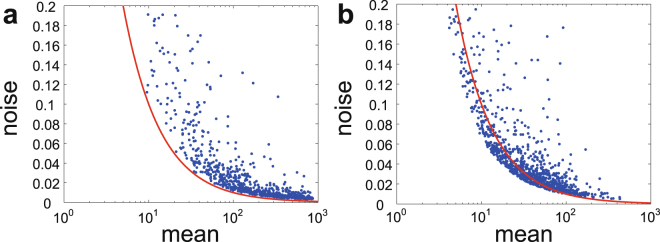
Figure 2.
Effect of feedback regulation on the protein noise by numerical simulations. (a) The protein noise versus the protein mean in positive-feedback networks under different choices of model parameters. The functional forms of and are chosen as and . (b) The protein noise versus the protein mean in negative-feedback networks under different choices of model parameters. The functional forms of and are chosen as and . In both (a) and (b), the red curve represents the Poisson noise and the model parameters are randomly chosen as , , where denotes the uniform distribution on the interval .

