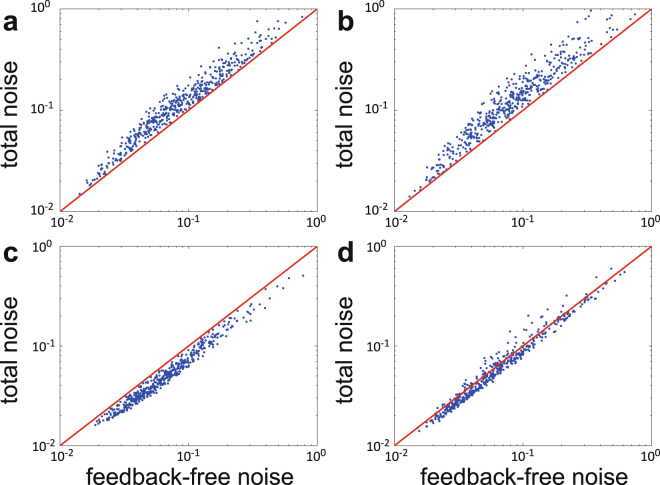
Figure 5.
Numerical simulations of the total noise versus the feedback-free noise in networks with positive or negative feedback under different choices of model parameters. (a) Positive feedback with fast promoter switching. (b) Positive feedback with slow promoter switching. (c) Negative feedback with fast promoter switching. (d) Negative feedback with slow promoter switching. In (a)–(d), the model parameters are chosen as , , , , , , where denotes the uniform distribution on the interval . Since is the mRNA synthesis rate when the promoter is active and is the average number of proteins synthesized per mRNA lifetime, the maximal protein synthesis rate is given by . The functional forms of the promoter switching rates are chosen as in (a),(b) and in (c),(d). Here the parameters are chosen as in (a),(c) and in (b),(d).

