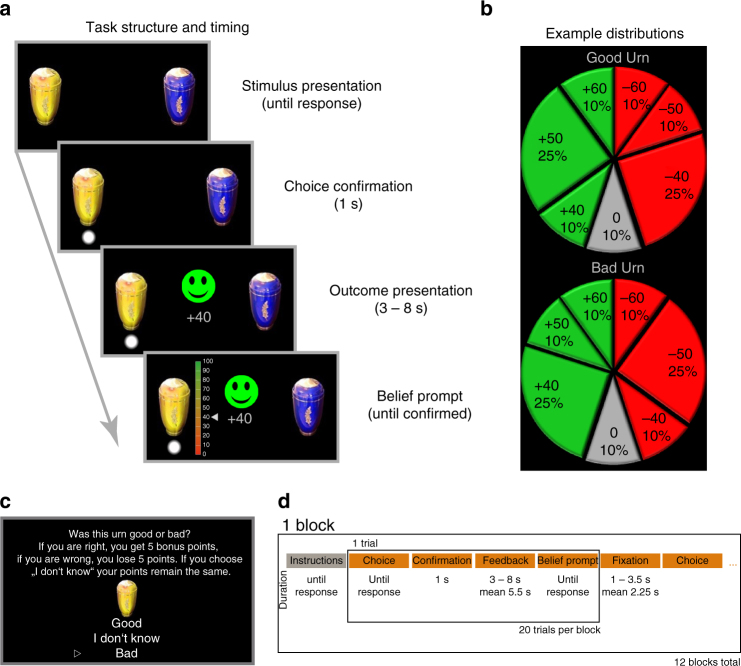
Fig. 1.
Task design. Schematic of an example trial and event timing of the task a. All participants were informed b about the exact probability of each possible event in two lotteries (represented by urns yellow and blue) in relation to their long-term valence by presentation of two pie charts. Good urns had a long-term expected value above and bad urns below zero. In this example a, a participant obtained a positive pay-out of 40 points, equivalent to 1.2€. However, this event is more likely to occur if the chosen urn indeed was associated with a long-term pay-out below zero (b, likelihood-ratio between urns 0.4). Therefore, a participant could infer that the likelihood of this urn to be good should be lowered by this experience, despite having just experienced winning 40 points. We prompted participants about their beliefs explicitly to the inferences performed (lowest display shows belief bar). Most events in the task (Table 1) carried long-term information as well as valenced short-term pay-out, which could either be congruent (short- and long-term valence align) or incongruent (short- and long-term valence mismatch). Between blocks of 20 trials (d), participants could earn bonus points if they correctly identified the true long-term pay-out of both urns (5 bonus points per correct answer). However, participants were also given the choice to avoid this gamble (c). On average, participants identified the true long-term valence of good urns correctly in 92 ± 2% and bad urns in 86 ± 5% and chose not to guess at all in 6 ± 3% of the cases. Note that the pie charts illustrating possible event distributions were constantly available to the participant in order to avoid high working memory loads which could interfere with learning and could render the task very difficult to solve

