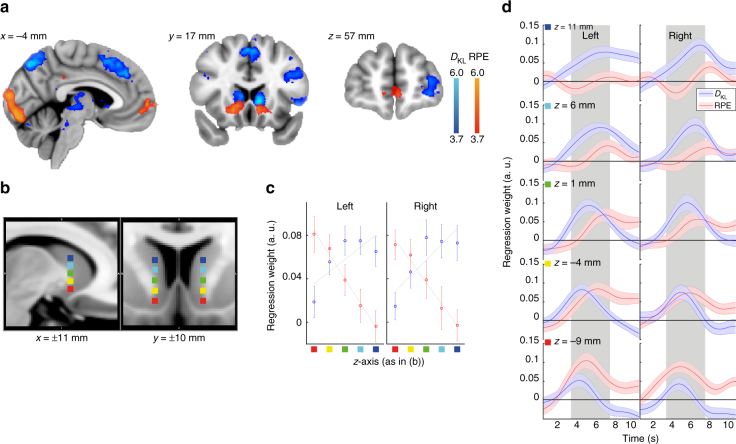
Fig. 3.
Effects of model-based inference and model-free experience. a Shows positive covariation with Bayesian model update (D KL, blue) and reward prediction-error (RPE, red). D KL was associated with activity in the intraparietal sulcus (IPS; peak Montreal Neurological Institute coordinates −14, −70, 54 mm, peak z-score = 6.00), posterior mesial frontal cortex (pMFC; 0, 27, 50 mm, z-score = 5.40), left dorsolateral prefrontal cortex (dlPFC; −45, 25, 27 mm, z-score = 6.03), and left frontopolar cortex (FPC; −35, 60, 6 mm, z-score 5.07). In addition, the dorsal striatum (caudate nucleus) covaried with D KL (right 9, 17, 6 mm, z-score = 5.07; left −9, 16, 2 mm, z = 4.94), whereas the ventral striatum covaried with RPE (right 14, 9, −8 mm, z = 5.51; left −9, 13, −8 mm, z-score = 5.00), for which an additional effect was seen in the ventromedial prefrontal cortex (vmPFC −4, 61, 3 mm, z-score = 4.89) extending into the medial FPC. A complete list of activations can be found in Supplementary Table 1. Spatial gradient analysis comparing functional main effects against anatomical location along the bilateral z-axis from ventral to dorsal striatum (x = 11, y ± 10 mm) in 5 mm steps (indicated by the colour-marks in b that correspond to the z-axis in c and plotted in d). Within-participant multiple regression time-courses of beta weights of an analysis comparing BOLD activity within these marked voxels against D KL and RPE per trial (including regressors of no-interest). c displays mean regression-weights from 3 to 7 s (grey area) which are compared against the z-axis marked in b in an across-participants regression model. The time-course of this signal is plotted in d. In the left and right striatum, RPE representation gradually decreases along dorsal position (both p < 0.0005), while D KL representation increases (both p < 0.0125), resulting in significant contrasts within both hemispheres at most ventral and dorsal seed regions (all p values < 0.001). Effects in a are thresholded at p < 0.0001, colour bars indicate z-scores, error-bars in c and shades in d reflect SEM of individual participants´ regression weights, lines in c reflect the OLS regression slopes of the averaged regression values for illustration purpose only. For an analysis of decision related neural correlates see Supplementary Fig. 6

