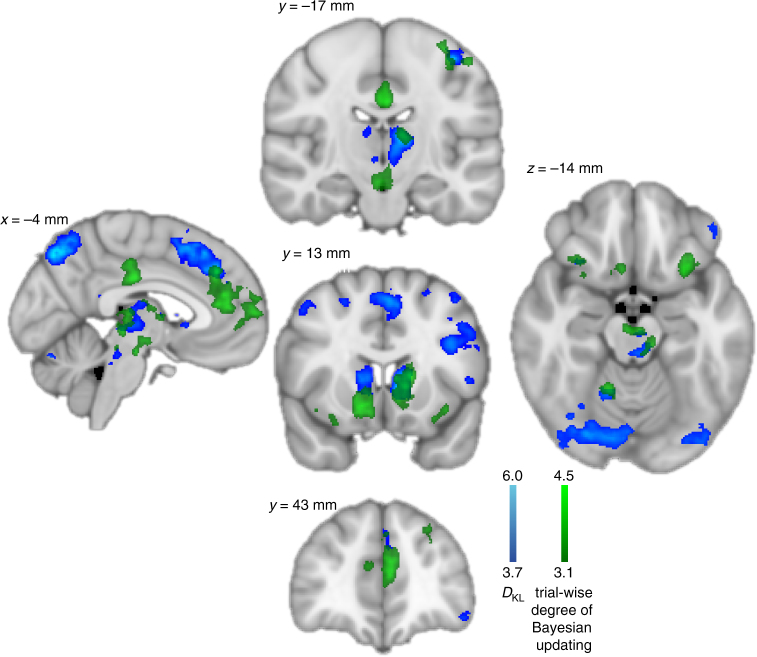
Fig. 4.
Trial-by-trial analysis of the degree of ideal Bayesian updating. Green = significant positive effects for regressor Bayesianness, indicating regions where BOLD signals increased whenever belief updates were closer to Bayesian ideal updating. Notably, activity in ventral (right 14, 13, −9 mm, z-score = 4.27) and dorsal striatum (left 14, 13, −9 mm, z-score = 4.27), FPC (−4, 62, 9 mm, z-score = 4.05), anterior midcingulate cortex (aMCC, −9, 36, 27 mm, z-score = 4.71), posterior cingulate cortex (PCC, −1,−19, 32 mm, z-score = 4.65) and midbrain overlapping with the substantia nigra (SN) and ventral tegmental area (VTA, −2, −12, −12 mm, z-score = 3.80), was found to be higher whenever a participant’s update was closer to optimal. See Supplementary Table 1 for details about significant cluster activations. All these effects at least partly overlapped with main effects of D KL (reproduced as in Fig. 3, depicted in blue) despite whole brain FWER correction. Colour bars indicate z-scores, plots are cluster extent corrected at p < 0.05

