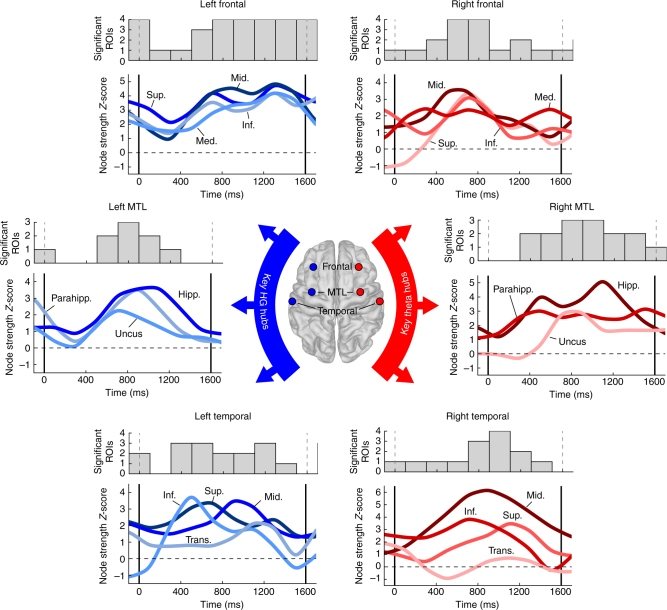
Fig. 4.
Timecourse of ROI participation in memory networks. Node strength as a function of time for 6 key regions that contain hubs in the theta or high gamma networks: right and left MTL, frontal lobe, and temporal lobe. Blue-shaded lines indicate asynchronous hub strength over time, while red indicates synchronous hub strength. Vertical lines indicate word onset and offset at 0 ms and 1600 ms. Above the z-scored timecourses are plotted the total count of specific ROIs within each broader region that reach significance at a given timepoint (P < 0.05). For visualization only, timecourses were smoothed with a 2-point moving average and radial basis filter

