Fig. 8.
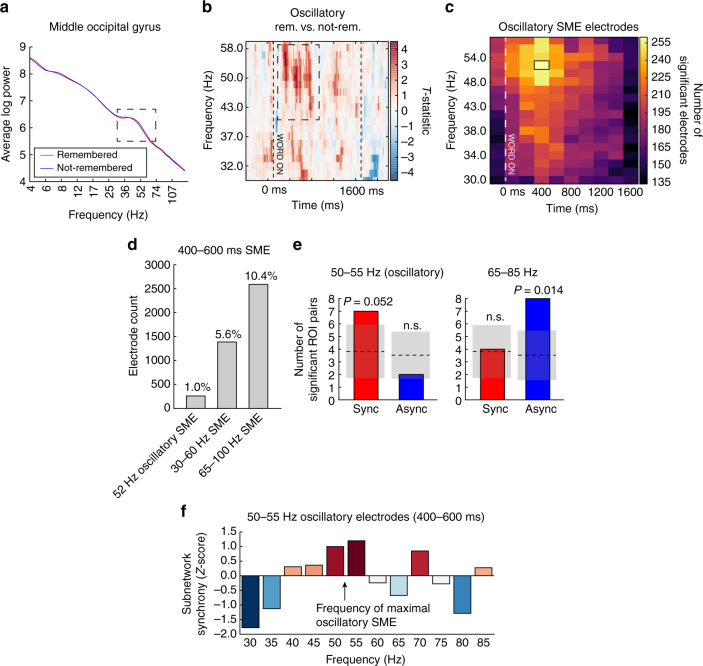
Synchronization of low gamma (30–60 Hz) oscillatory activity. a Example of an electrode exhibiting a gamma oscillation in the middle occipital gyrus, as detected by BOSC (see Methods section for details). Red line reflects average log power across all remembered events, blue line reflects average log power across not-remembered events. An isolated peak in the power spectrum is indicated, between approximately 36 and 74 Hz. b For the electrode in a, heatmap of the t-statistic reflecting the relative frequency of oscillations detected in remembered vs. not-remembered trials. Red colors indicate more oscillations detected at given frequency and timepoint in trials that were later remembered correctly. Vertical lines indicate word onset and offset (0 and 1600 ms). T-statistics < 2 are faded, for visualization only. Increased oscillatory power from 43 Hz to 58 Hz, coincident with the oscillatory peak in a, is indicated. c Count of all electrodes in the 294-subject data set that exhibit an oscillatory subsequent memory effect (SME) between 30 and 58 Hz, at each 200 ms epoch spanning the word presentation interval (Methods section). The most electrodes exhibit oscillatory SMEs at 52 Hz, between 400 and 600 ms after onset of a word (black box). d Count of electrodes in the data set that exhibit different kinds of SMEs between 400 and 600 ms: 52 Hz oscillation, 30–60 Hz average power, or 65–100 Hz average power. e Count of significant synchronous or asynchronous network connections using only the subset of electrodes exhibiting 52 Hz oscillatory SME at 400–600 ms. Synchronization effects were deemed significant at P < 0.05, with the chance mean and standard deviation at this significance level indicated in the gray shaded area. Left: counts observed at 50–55 Hz, near the frequency of maximal oscillatory SMEs (52 Hz). Right: counts observed in the 65–85 Hz range among the same electrode subset. The frequency/synchrony interaction is not significant (P = 0.11). f Average network synchrony (z-score) for the subnetwork of regions sampled in the 52 Hz oscillatory electrode subset, measured by summing the subnetwork connection weights at each frequency in the 400–600 ms window, and comparing to the sum expected by chance

