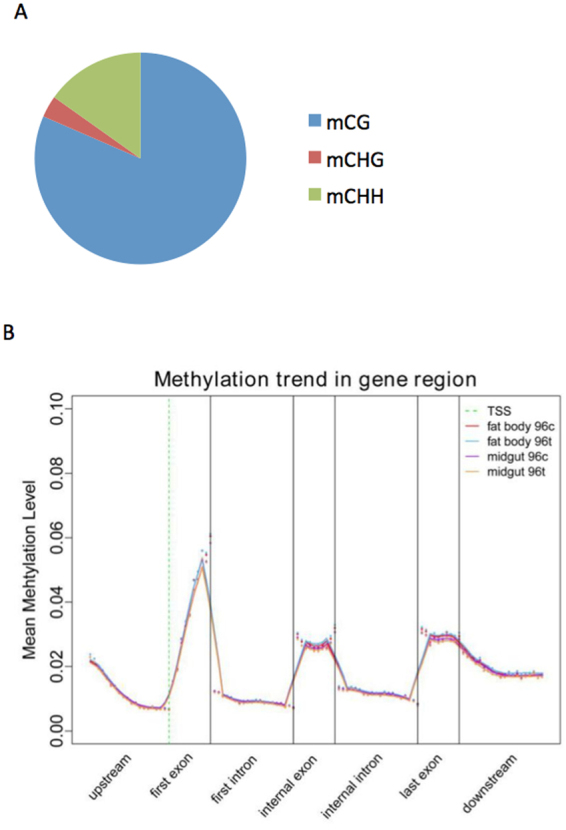
Figure 3.

Average DNA methylation level and the distribution in the whole genome in four samples. (A) The average proportion of different types of methylated cytosines in the four samples. (B) Distribution of DNA methylation levels of genes in four samples. The gene structure is defined by seven different features, denoted by the x-axis. The length of each feature was normalized and divided into equal numbers of bins. Each dot denotes the mean methylation level per bin and the respective lines denote the 5-bin moving average. Each feature was analyzed separately for the numbers listed in the table below the figure. The green vertical line indicates the mean location of the transcription start sites.
