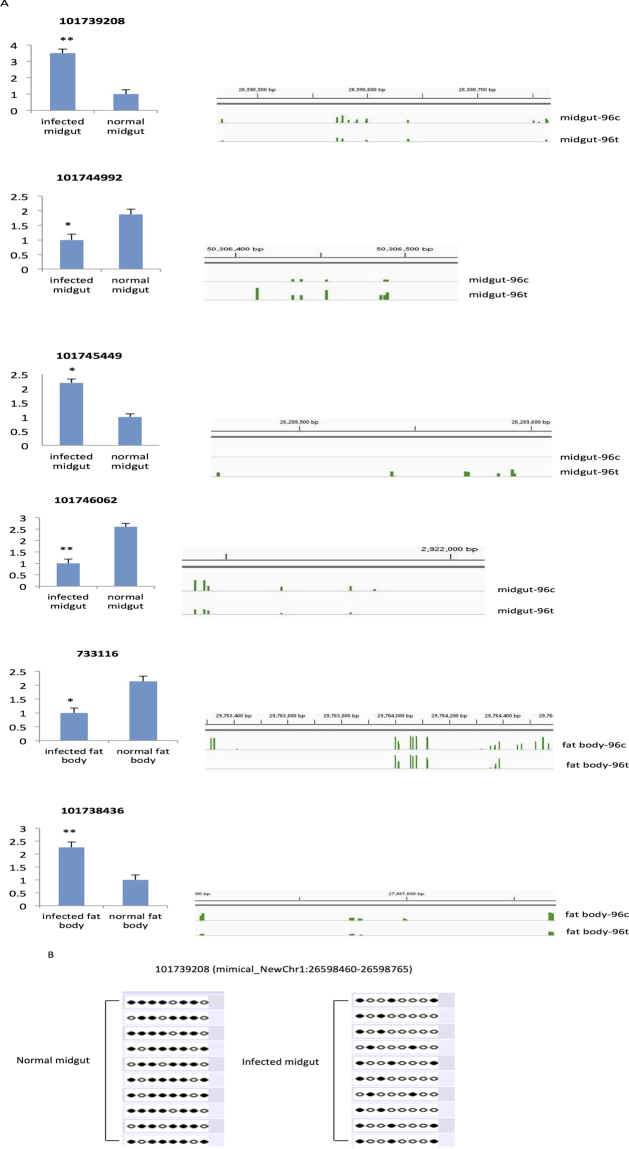
Figure 5.
Both differentially expressed and differentially methylated genes in response to BmCPV infection. (A) Six genes were identified to be differentially expressed in midguts or fat bodies upon BmCPV infection by qRT-PCR on left side. RNA was extracted from midguts and fat bodies with or without BmCPV infection. Data represent the relative transcript levels of genes in the infected midguts or fat bodies compared to the control tissues from three independent samples. The error bars indicate standard deviations (**p < 0.01, *p < 0.05). The visualized image of differential methylation genes (right side) was generated by Integrative Genomics Viewer (IGV). The identification of methylated regions was performed by CpG_MPs (v1.1.0) with the required sequencing depth great than 10 and average C methylation ratio great than 0.55, and then converted to wig format by perl script for visualization on IGV. The location of green bars in the images indicates the methylated sites and the height of green bars represents the methylation levels. (B) Bisulfite sequencing validation of differentially methylated 101739208 in normal verse infected midgut. Targeted bisulfite sequencing validation of a region overlapping the DMR is indicated by the rectangle over the genome browser tracks. Dark circles indicate methylated and open circles mean unmethylated cytosines. Each row consists of a single sequenced clone.

