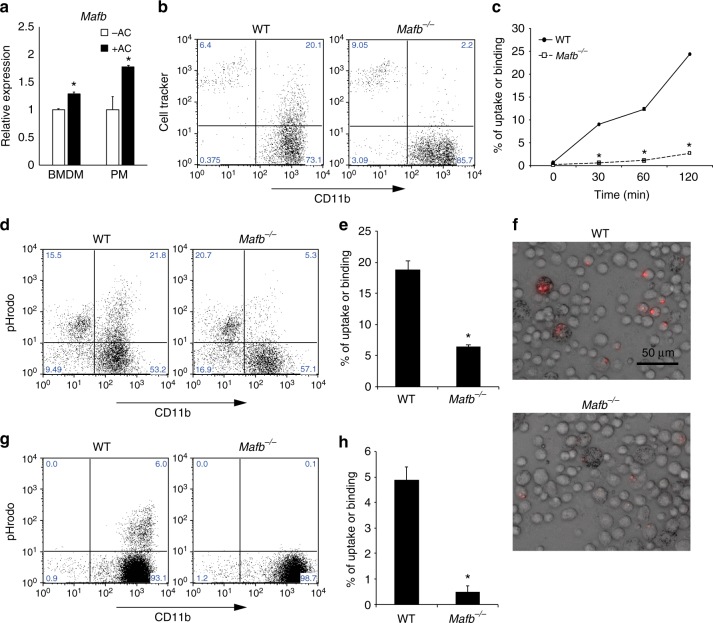
Fig. 1.
Mafb-deficient macrophages are unable to engulf apoptotic cells. a Apoptotic cell-induced expression of Mafb in both BMDMs and PMs. Mafb mRNA was quantified by qRT-PCR; n = 4 for each group. The data were normalized to Hprt mRNA levels and are presented as the mean ± s.e.m., *p < 0.05 compared with apoptotic cells (−AC) (Student’s t-test). The data are from one experiment representative of two independent experiments. b, c Jurkat T cells were induced to apoptosis and labeled with CellTracker. Apoptotic cells were incubated with WT and Mafb −/− macrophages. CD11b and CellTracker double-positive populations represent macrophages that bind and/or engulf apoptotic cells. c The percentage of binding or uptake of apoptotic cells was increased in a time-dependent manner in WT but not Mafb −/− (WT, n = 5; Mafb −/−, n = 6). d, e Apoptotic thymocytes were stained with pHrodo and incubated with fetal liver-derived macrophages for 120 min. e The percentage of cells that were taken up was significantly reduced in Mafb −/− macrophages (n = 5 for each group). g, h, f Peritoneal exudate cells (PECs) were analyzed by FACS after apoptotic thymocytes treated with pHrodo were injected into the mice, which were injected with thioglycolate 3 days before. h The percentage of apoptotic cell uptake was significantly reduced in Mafb −/− macrophages (WT, n = 4; Mafb −/−, n = 5). f Microscopic analysis showed that pHrodo fluorescence was observed in the PECs of WT, but not Mafb −/−. c, e, h Quantification data are presented as the mean ± s.e.m. *p < 0.05 compared with WT, (Student’s t-test). The data are from one experiment that was representative of at least two independent experiments

