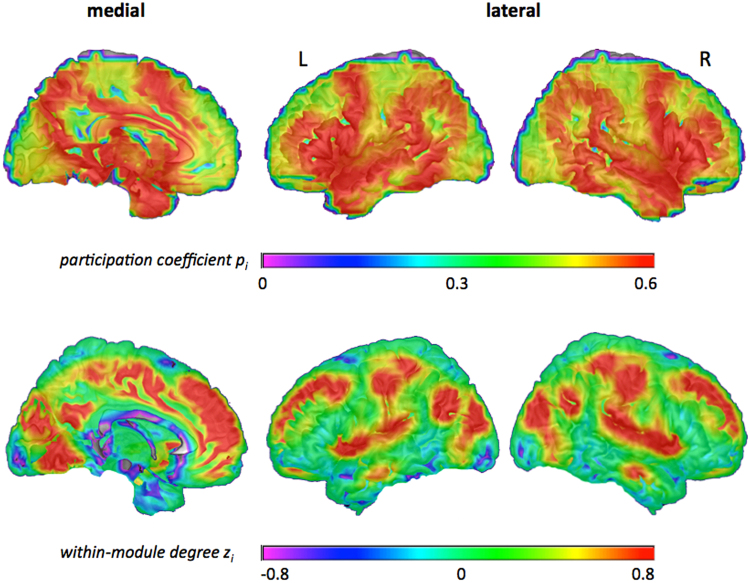
Figure 1.
Values of participation coefficient p i (top row) and within-module degree z i (bottom row) averaged across all participants. Higher values are shown in warm colours (green to red), lower values are shown in cool colours (blue to pink). Graph metrics (p i and z i) were calculated for binarised and proportionally thresholded graphs using five different cut-offs (i.e., graphs were defined by the 10%, 15%, 20%, 25%, or 30% strongest edges). For each participant, individual mean maps for the graph metrics were calculated by averaging across the five thresholds. Displayed here are the group average maps for p i and z i that resulted from averaging all individual mean maps across participants (see Methods section for details on the procedure). For the lateral view, values were projected to the surface of the brain. The medial view displays graph values in the x-plane. L, left; R, right.

